Users' Diaries

Recent diary entries

Hi again!

In my previous diary entry I introduced myself and my GSoC project with Valhalla, and I mentioned we were still putting the finishing touches on the exact main goal. Now we have it! We’re focusing on area routing. This is basically means making the router cross open pedestrian areas (like squares) instead of walking around them and generating weird and inefficient routes. This diary entry is a deep dive into the research I’ve done while exploring the different options.

The problem with pedestrian areas

When you ask a router to go across a square, you would expect it to cross it like any person would. But a lot of routers don’t do that, they may send you around the perimeter or go along the streets surrounding the square. The problem here is that the open area has no “ways” inside of it to travel on.

Let’s see one example (using Valhalla) on Plaza Santo Domingo in Murcia (my hometown!):

See full entry

Please help me raise funds to purchase the missing sheets from the complete historical 1:50,000 topographic map series of Zimbabwe, formerly Rhodesia.

https://gofund.me/f12d5f3d2

Donate and more information at https://www.gofundme.com/f/purchase-historical-zimbabwe-topographic-maps

Previous donation drives:

In the unlikely event that any funds remain after purchasing the Zimbabwe map sheets, they will be used to buy missing sheets from the Lesotho or Malawi 1:50,000 topographic map series, which are planned as future projects.

Location: Braeside, Harare, Zimbabwe

If you use the amazing better-osm-org browser extension/userscript to review changesets, you are probably familiar with its default red, green, and yellow diff highlighting.

While the default colors are great, sometimes you want a custom color scheme that feels more comfortable for your eyes during long validation sessions. For instance, changing the added tags to a cool cyan, keeping deleted tags red, and making modified tags a soft cream/yellow.

Since the script dynamically manages light/dark themes, the easiest way to override these colors globally without messing up the extension’s code is by using custom CSS via the Stylus extension.

How to Apply It:
  1. Install the Stylus extension (Chrome/Firefox/Edge).
  2. Go to openstreetmap.org.
  3. Click the Stylus extension icon and select ”(+) Write style for: openstreetmap.org”.
  4. Paste the CSS code below into the editor, give it a name (e.g., Better OSM Custom Colors), and hit Save.
The CSS Code:
/* 1. MODIFIED TAGS -> SOFT CREAM / YELLOW */
    tr.quick-look-modified-tag th,
    tr.quick-look-modified-tag td {
        background: rgba(255, 235, 150, 0.7) !important;
        color: #000000 !important;
    }

/* 2. DELETED TAGS -> RED */
    tr.quick-look-deleted-tag th,
    tr.quick-look-deleted-tag td {
        background: rgba(238, 51, 9, 0.6) !important;
        color: #000000 !important;
    }

/* 3. NEW TAGS -> CYAN */
    tr.quick-look-new-tag th,
    tr.quick-look-new-tag td,
    tr.quick-look-added-tag th,
    tr.quick-look-added-tag td {
        background: rgba(0, 200, 220, 0.6) !important;
        color: #000000 !important;
    }

As I had mentioned in my last post where I explain what they are, I had long planned to make a video about mapping historic lifting stones. It took a while to get to sites and some footage etc and to figure out how to map them best, at least in my opinion, but the video is now online on Youtube. I’ve added subtitles in English, German, Irish, Basque, Finnish, Icelandic and Welsh, because these are to my knowledge the countries where the tradition is still upheld or has been revived. For everything but German, I used the auto-translate function, but YouTube tends to not know the correct word for “lifting stone” in the respective languages, so if anyone can correct me on the subtitles, I’d be grateful. For the same reason, I did not translate the title of the videos into most of these languages, and also because I didn’t want to give the impression that it was completely available in these languages. It is possible now, I think, to have the audio generated in other languages, but that is too creepy to me. As curious as I am to hear myself speak fluent Welsh, I’ll give it a pass.

I’m hoping to do another shorter video about mapping them using OSMAnd, but I need to get to a site of an unmapped stone first which is easier said than done, considering I don’t drive and there are not that many unmapped ones near me. The sites in the current video were accessible by public transport, walking and cycling, so it’s a very sustainable video in its production.

I’ve also done a bit more work on the English wiki page for historic=lifting_stone, translated it into German and written a wiki page for leisure=lifting_stone. The latter is for the newly placed stones and the historic ones that are being lifted again.

I would appreciate if people capable of the above languages could translate the wiki pages into those languages to get a wider coverage of them being mapped.

En menos de un mes, en Colombia vamos a organizar el primer State of the Map. Este evento conmemora muchas cosas: primero, que la comunidad OSM Colombia es capaz de hacer un evento de marca internacional; segundo, que tenemos una entidad formalmente organizada para representar la comunidad la cual es la Asociación de Cartografía Colaborativa de Colombia - AC3; tercero, que dicha Asociación es oficialmente un capítulo de la fundación OpenStreetMap mundial, para representar a OSM en Colombia.

Como parte de la organización que estamos haciendo, queremos invitar a muchas personas que estén interesadas en el mapa para que nos reunamos por motivo de este evento, ya que no son solo charlas de OSM, sino también es unir a la comunidad, compartir, conocerlos. Entre las cosas que queremos, es proponer un punto de encuentro para todos esos mapeadores de OSM, y no solo los usuarios actuales sino que también queremos invitar a esos usuarios que contribuyeron mucho en el pasado, y que de pronto ya no están tan interesados en el proyecto, pero de pronto, al ver a la comunidad unida, se vuelven a interesar.

Para esto no encontré una utilidad en Internet disponible. Como ya lo mencioné entre líneas, la de Neis Pascal es solo para los usuarios que han contribuido en los últimos 60 días, pero queríamos tener la lista de los usuarios que han apoyado al mapa de Colombia desde su origen. Entonces, por medio del IDE Cursor y con un par de buenos prompts de AI, me generó este proyecto: https://github.com/angoca/topOSMcontributors.

Después de descargar el archivo de GeoFrabrik que es con el que se puede hacer la magia, se procesaron todo el histórico de Colombia y pude obtener los 500 usuarios que más han contribuido en Colombia.

See full entry

Location: UPZs Localidad Teusaquillo, Localidad Teusaquillo, Bogotá, Bogotá, Distrito Capital, RAP (Especial) Central, Colombia

Read in EnglishLeia em portuguêsTélécharger le PDF en français


IVIDES DATA® contribue à former de nouveaux cartographes au Cameroun et réaffirme son engagement à diffuser la connaissance d’OpenStreetMap dans les pays ultramarins


Au cours du premier semestre 2026, IVIDES DATA® a eu l’opportunité d’agir en tant que sponsor du projet CityMapper Externship, coordonné par Modo Levo Engelbert Steve, ambassadeur du chapitre camerounais de l’Initiative des ambassadeurs de la communauté UN Maps, un programme géré par le Centre de Service Mondial des Nations Unies (UNGSC). Le projet s’est concentré sur la cartographie urbaine collaborative et s’est déroulé du 30 avril au 30 mai, avec pour objectif de cartographier les éléments liés aux infrastructures urbaines. La stratégie du programme s’aligne sur les objectifs de développement durable de l’Agenda 2030 : ODD 11 (Villes et communautés durables), ODD 13 (Action pour le climat) et ODD 17 (Partenariats pour les objectifs), et vise à répondre à un besoin commun dans de nombreux pays africains : la cartographie systématique du territoire national, la génération de données ouvertes et la formation des jeunes citoyens.


See full entry

Location: Centre Commercial, Yaoundé I, Yaoundé, Mfoundi, Région du Centre, Cameroun

Lire en françaisLeia em portuguêsPDF download in English


IVIDES DATA® support the training of new mappers in Cameroon and reaffirms its commitment to expanding knowledge about OpenStreetMap to countries overseas


See full entry

Location: Centre Commercial, Yaoundé I, Yaoundé, Mfoundi, Centre, Cameroon

Read in EnglishLire en françaisDownload PDF em português


IVIDES DATA® ajuda a formar novos mapeadores em Cameroun e reafirma o seu compromisso em expandir o conhecimento a respeito do OpenStreetMap para países além-mar


No primeiro semestre de 2026, a empresa IVIDES DATA® teve a oportunidade de patrocinar o projeto CityMapper Externship: Urban Street Mapping Level, coordenado por Modo Levo Engelbert Steve, embaixador do capítulo de Cameroun, no UN Maps Community Ambassador Initiative, programa mantido pelo United Nations Global Service Center - UNGSC. A iniciativa teve como foco o mapeamento urbano colaborativo, tendo se desenvolvido ao longo do período de 30 de abril a 30 de maio, com o objetivo de mapear feições relacionadas à infraestrutura urbana. A estratégia do programa se alinha com os objetivos de desenvolvimento sustentável da Agenda 2030: ODS 11 - Cidades e comunidades sustentáveis, ODS 13 - Combate às alterações climáticas e ODS 17 - Parcerias em prol das metas; e visa atender a uma demanda importante, que é comum a diversos países africanos: o mapeamento sistemático do território nacional, a geração de dados abertos e a capacitação de jovens cidadãos.


See full entry

Location: Centre Commercial, Yaoundé I, Iaundé, Mfoundi, Centro, Camarões

I’ve been working recently on a personal project to investigate how much of the Overpass query language could be implemented using a different back end database, namely the QLever database.

Overpass is the most widely used public interface for querying OSM data. It is relatively easy to use and understand and its outputs in GeoJSON or OSM XML are readily integrated into OSM or other geospatial tool chains for visualization or other processing.

But Overpass is somewhat of a victim of its success. Demand for the public Overpass service has recently outpaced server capacity. My earlier work on a container image for Overpass was intended to help scale capacity by making it easier for data consumers to run their own local Overpass servers.

This project looks in a different direction. What if the Overpass QL with its ease of use and its integration into other tools were available on top of a different data source?

QLever

QLever is a SPARQL database developed by the Chair for Algorithms and Data Structures at the University of Freiburg. SPARQL is an RDF query language where the data are represented as “triples” of a subject, predicate, and object.

QLever represents geospatial data as WKT and can perform geospatial operations on WKT. The osm2rdf conversion generates WKT data for every OSM element. So, the data in QLever stores the complete geometry from OSM.

But the key to QLever’s performance with OSM data is that in the conversion from OSM PBF to TTL (Terse RDF Triple Language), osm2rdf generates triples for every element to describe their spatial relations with other elements. That is, osm2rdf pre-computes the spatial relations sfIntersects, sfContains, sfCovers, sfTouches, sfCrosses, sfOverlaps, and sfEquals between all OSM elements.

See full entry

Posted by Jiri Podhorecky on 7 June 2026 in Czech (Česky). Last updated on 26 June 2026.

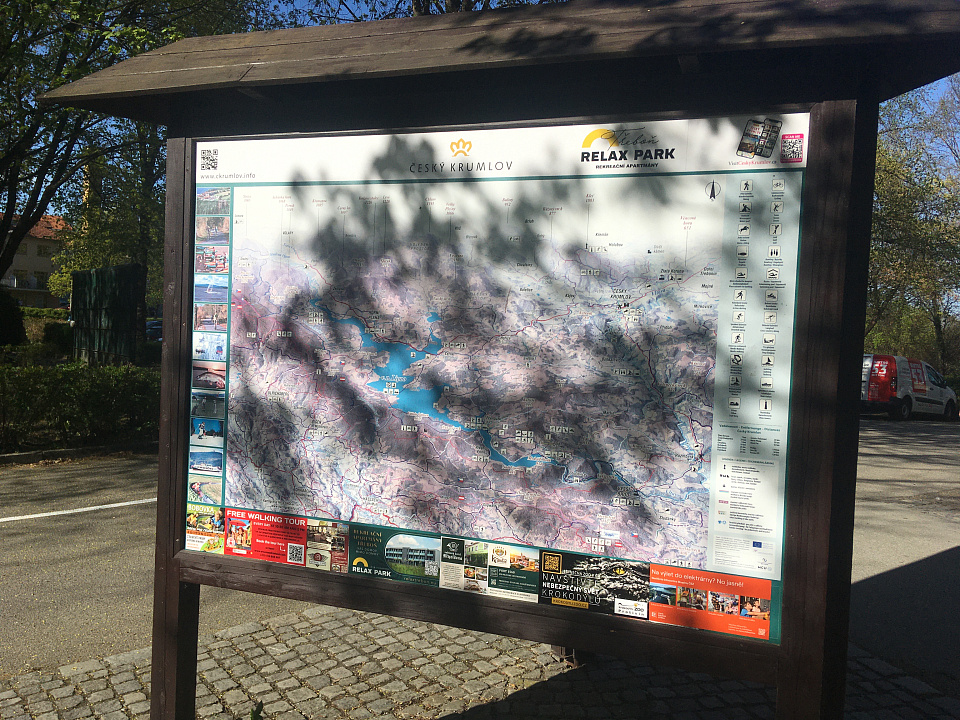
Znáte to velmi dobře. Zastavíte se na kole na rozcestí někde u Lipna, na okraji národního parku na Šumavě, nebo u vstupu do historického centra Českého Krumlova. Před vámi stojí klasický mapový stojan. Velká tištěná mapa, kolem ní pár fotek a na okraji nechybí to, co definuje naši současnou snahu o propojení světů: QR kódy.

Mapa

Naskenujete čtvereček a telefon vás odkáže na lokální nabídku zážitků, otevírací dobu půjčovny lodí nebo menu nedaleké restaurace. Je to praktické a funkční. Fyzický prostor mapy se tu potkává s digitálním obsahem. Ale ruku na srdce, je to teprve začátek. QR kód je sice skvělý vynález, ale z principu je příliš pasivní, statický a jednoduchý na to, aby dokázal přenést skutečnou dynamiku a komplexitu světa až k vám. A vy ten místní svět přece chcete vidět, zažít právě teď.

See full entry

Posted by AriAlvarez on 7 June 2026 in English. Last updated on 11 June 2026.

This is a personal note so I remember the settings to use depending on my method of transportation:

Bicycle:

  • Mode: 360 Timelapse Video
  • Interval: 0.5 seconds
  • Resolution: 5.6k
  • Enable HyperSmooth if possible
  • EV compensation: +0.5
  • ISO: 100 Min, 200 Max
  • Color Profile: Flat
  • Remember to point one camera to the right, the other to the left. Maximizes aerodynamics and captures better quality images of signs.

  • ALSO, try 360 Timelapse Photo. I received way too much pixelation using timelapse Video, so I need to experiment with timelapse photo. Photos will always look better than photos which were extracted from video.

Walking:

  • Mode: 360 Time Lapse Photo
  • Resolution: Max
  • Interval: 2 seconds
  • Enable HyperSmooth if possible
  • EV compensation: +0.5
  • Color Profile: Flat
  • ISO: 100 Min, 200 Max
  • If photos appear too clustered, increase time of interval

Car Interior:

  • Mode: Standard Video
  • Resolution: Max
  • Frame rate 30 fps for forward view
  • Frame rate 60 fps for side view (to reduce motion blur)
  • Field of view: Linear for side shots, Wide for more vertical coverage. Never use SuperView
  • Horizon Leveling: Off
  • Enable HyperSmooth if possible
  • EV compensation: +0.5
  • Color Profile: Flat
  • ISO: 100 Min, 200 Max
  • For side shots, best to angle 45 degrees for best of both worlds.

Car Exterior:

  • Mode: 360 Video (continuous)
  • Frame rate: 24 or 30, need to play around with it
  • ISO: Min 100, Max 200
  • EV Compensation: +0.5
  • Color Profile: Flat
  • Shutter Speed: Auto

ISO above 200 causes picture clarity problems. Remaining under 200 ensures that daylight photos are clearer and signs can be read better. Leaving the Color Profile Flat preserves maximum detail in shadows. None of the images might be appealing to the eye, but they will be very good for mapping purposes

Posted by aleesteele on 6 June 2026 in English.

Hi folks! I’m up for election to HOT’s voting membership this year (thank you, Pete!). As a part of that process, I’m posting my answers to their prompting questions here on my OSM diary.

I know that I already owe this community a summary of my previous research within the OpenStreetMap ecosystem – and what’s changed since then. By way of explanation and apology: I wanted to flag that I will be giving a talk at this year’s State of the Map in Paris with an update on my previous work. You can see the talk I gave in 2022 here. I also gave a talk at the HOT Summit in 2021.

I also want to flag that no LLMs were used in the writing of these answers: while I do use them sometimes for more functional, repetitive, or iterative work, I did not use them below. Writing is often a form of thinking for me, and for these answers, I wanted to prioritize that process.

What does HOT mean to you?

In the last 6 or so years, HOT has both professionally and personally changed how I think about technology, community, and crises. It’s also meant different things at different times for me – which I wrote a bit more about in the question below.

In short: I’ve come to see HOT (and humanitarian mapping more broadly) as a kind of canary in the coal mine for the broader technology ecosystem at large. The questions I found here, at HOT and across OSM are ones that I have later found in the broader ecosystems they feed into (and even the world at large): questions about navigating permacrises, about AI, about shifts in funding landscapes, about ethical dilemmas for data pipelines, about cross-cultural community-building, and many, many others.

How did you become involved with HOT?

I have perhaps an unusual path to being involved with HOT: I was an anthropologist and ethnographer of the ecosystem of humanitarian mapping that HOT feeds into before becoming involved as a mapper and facilitator in the past few years.

See full entry

El proyecto de importación de desfibriladores (DEA) en Málaga ya está publicado y abierto a la participación de mapeadores locales. La coordinación se llevará a cabo desde el grupo local OSM Málaga, un grupo pequeño y cercano de mapeadores que conocemos bien la zona.

Mapa de la zona del puerto de Málaga con marcadores en forma de corazón de color azul y rojo. En la esquina inferior izquierda, el logotipo del grupo de trabajo OSM Málaga; en la esquina inferior derecha, el logotipo de Málaga Cardioprotegida. En la parte superior de la imagen. se observan las fotografías circulares de un par de desfibriladores y el logotipo de la propuesta Ayuntamiento de Málaga Import.

Esta importación llevaba tiempo pendiente dentro del plan de importación de datos abiertos del Ayuntamiento. He trabajado en adaptar el formato original y preparar los datos para su incorporación a OpenStreetMap. La revisión de la calidad de las ubicaciones se realizará durante la fase colaborativa, aprovechando el conocimiento local y la verificación sobre el terreno.

En importaciones anteriores basadas en datos abiertos municipales, el resultado final en OSM ha terminado siendo más completo y preciso que el conjunto de datos original, gracias al trabajo conjunto de la comunidad. La intención es que esta importación siga el mismo camino: no solo añadir datos, sino mejorarlos.

See full entry

Location: Centro Histórico, Centro, Málaga, Málaga-Costa del Sol, Málaga, Andalucía, España