Posted by petrusko on 15 April 2026 in French (Français).
Last updated on 26 July 2026.

Ajout du parcours de “La Chartreuse” à Dijon (21)
Par ici : osm.org/node/13731747305
Des infos par ici : https://www.discjonctes.fr
 OpenStreetMap
Par ici : osm.org/node/13731747305
Des infos par ici : https://www.discjonctes.fr
Membantu orang hendaknya ikhlas, dan tidak mengharap pujian atau apresiasi dari orang lain. Bantulah dengan bantuan yang terbaik. Dan tidak perlu kita mengungkit-ungkit bantuan yang kita berikan, berharap balasan dari ALLAH subhanahu wata’ala semata. Caranya mudah, bantuan yang engkau berikan itu ibarat yang engkau keluarkan dipagi hari. Dengan begitu engkau akan lupa, tidak ingat bantuan apa yang telah engkau berikan kepada orang lain

I had the opportunity to solely lead Nepal’s first Inclusive Mapping Week 2025 at Kathmandu University. What started as an idea became a week-long initiative bringing together over 400 participants to learn, map, and collaborate.
Throughout the program, we focused on both technical skills and real-world applications:
Humanitarian mapping using OpenStreetMap Remote sensing with Google Earth Engine Crisis mapping and spatial data use Field mapping with tools like Mapillary and OSM Tracker
One of the most meaningful aspects of this initiative was contributing mapping data to support earthquake-affected regions. It reinforced how open geospatial data can play a role in disaster preparedness and response.
As a young woman in the geospatial field, leading this initiative was both a challenge and a responsibility. Ensuring inclusivity and encouraging participation especially from women was at the core of this program.
Being recognized by The Annapurna Express for this work was a proud moment, but what matters most to me is the impact created through collective effort and open collaboration.
This experience taught me that:
Mapping is not just technical work—it creates real-world impact Leadership is about enabling others to contribute Inclusive communities build stronger, more meaningful maps
This is just the beginning of my journey with OpenStreetMap. Looking forward to contributing more, learning more, and building maps that represent people, communities, and realities. youthmappers blog; https://www.youthmappers.org/post/she-leads-we-map-nepal-s-first-inclusive-mapping-week-2025 The Annapurna Express: https://lnkd.in/g6ZSgBBq
ww
Sometimes, we set out to solve one problem and arrive at a bunch of even greater discoveries along the way. This story starts with my curiosity about whether you can get a “GPS” track log underground - like in a tunnel or underground car park. GPS is our go-to tool for mapping most things that we can’t see on aerial imagery, but what can we do in places where GPS signals cannot be received? In the course of my investigation, I uncovered a few even more interesting insights:
Oh, and I did manage to get that underground track log, but more on that anon…
Mapping underground features in OSM can be challenging. Sometimes we are lucky - a tunnel or covered roadway may be a straight line between two known points on the surface. Perhaps the tunnel was built using cut-and-cover and we were able to establish the geometry during construction. But sometimes, we just have an underground linear feature with bends in it. We know where each end dives underground, but GPS signals cannot be received underground, so our traditional mapping approaches won’t help us.
Road tunnels, of course, are designed for vehicles, and many modern vehicles have moving map displays as part of a navigation system. When in a tunnel, many even show a plausible vehicle position that updates. Without GPS. How do they do that? They could simply infer movement along the mapped path of the road based on distance travelled. But they may also use more sophisticated dead-reckoning inferring direction from sensors. I have such a car. I wanted to find out.
In the second week (14th–19th February), we faced OSMMalawi. With no strategy to balance academics and mapping, I grew lazy. To overcome this, I wrote a sticky-note reminder on my laptop to push myself to map at least five tasks daily during breaks. By the end of the week, my contributions increased, and on 20th February, we celebrated another win, rising to 3rd place overall.
The third week (21st–26th February), the mapping match was against KabUyouth Mappers from Uganda. Bing imagery was unclear, but I adapted by using Google Earth references & comparing different imageries. My changesets piled up, promoting me from beginner to intermediate mapper. . We maintained the 3rd position but our captain organized a google meeting with Kingsley (one of the tournament organizers), who taught us valuable skills in both iD editor and JOSM.
By the fourth and fifth weeks (28th February–12th March), mapping had become part of my routine—even appearing in my dreams! Funny!!, am I right?
Despite some abrupt technical issues with OpenStreetMap login, we pushed through, won the game against YouthMappers Mukuba, and advanced to the next stage. By the end, we’re proudly ranked 4th among the top 10 contributing teams out of approx. 80 countries.
Thank you for reading my diary—I hope my journey inspires someone out there. Let’s map the world together! #SpatialMappers #AfricaMapCup2026. Cheers to all participants in this tournament, and please wish my team & I good for it’s still on going.
Every day at around 4 pm (unless there’s IRL business that I have to attend to), I log in to https://osmbc.openstreetmap.de/ to edit this week’s edition of WeeklyOSM.
My task is to review all the links submitted by both WeeklyOSM editors and guest users. I study each link, then write a short sentence describing it.
Some link submitters already accompany their links with proper sentences when submitting, so I mostly skip those. I only focus on links that don’t have English text yet.
This afternoon, while doing my daily WeeklyOSM editing, I stumbled upon this MapComplete post announcing that it is now possible to add pictures to reviews on MapComplete. This feature is powered by Mangrove Reviews.

Then, I suddenly remembered a certain discussion thread on c.osm.org regarding the possibility of building “a crowd-sourced review service for OpenStreetMap.”
I remember when my captain and I searched for willing mappers in our community to register for the tournament, which required at least 20 participants per team. One colleague discouraged me, saying it was highly impossible for us to be among the winners. However, that didn’t stop me from learning JOSM and joining the tournament.
In the first match week (7th–12th February), my team faced Carto Afrique of Kenya. The transition from iD editor to JOSM was amazing—tasks that once took over an hour now took only 30–40 minutes, giving me time to complete more. JOSM’s validation tool saved us from penalties by detecting errors before uploading.
On 13th February, the results were announced: my team won against Carto Afrique! That victory gave us our first point, lifted our spirits, and placed us 5th among the top 10 contributing teams. Yet, as my semester began, I feared balancing mapping with academics, sports, and assignments which would be tough, making the experience even more intense. ……..thank you to those that are reading my dairy. comment your review and lets share our experiences.
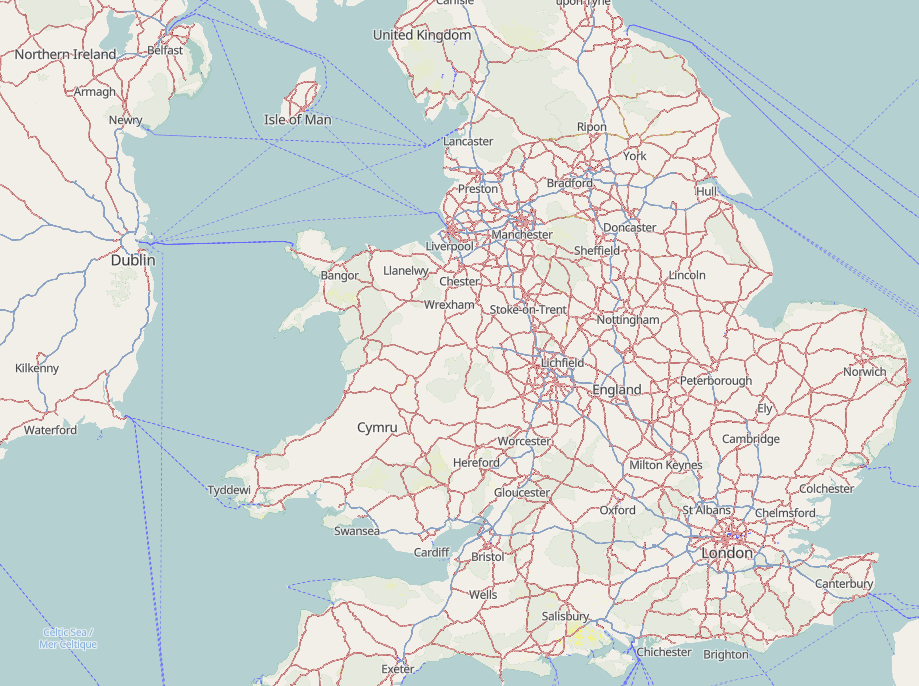
I’ve been creating and serving web-based maps such as this one for some time. That’s based on raster tiles, and an osm2pgsql database is used to store the data that the tiles are created from, on demand as a request to view a tile is made.
For various reasons I wanted to also create a similar map using vector tiles. With vector tiles what is sent to the client (such as a web browser) is not lots of small pictures that the client stitches together, but instead larger chunks of data, still geographically separated. The client then creates the map itself based on the style that it has been told to show the data in, combined with the data itself.
I’d noticed that the vector maps that I was displaying were sometimes slow to load, especially at some lower zoom levels such as vector zoom 8. Note that vector zoom levels are one less than raster zoom levels, so vector 8 is raster 9.
The Beginning – Discovering JOSM..
I never imagined my mapping journey would reach this point in time. I would like to share with you my experience, which carried both doubts and excitement for my team and me—the thrill of learning Java OpenStreetMap (JOSM) and climbing the staircases that led to building victories in the Africa Map Cup 2026 Tournament. My name is Alvin Andrew Barugahara, also known as AlvinB (OSM name), a student from a mapping community in Uganda called Spatial Mappers at Ndejje University. I had always heard of JOSM and its simplicity in mapping OSM tasks. Back then, I was just a beginner mapper using iD editor, which was the default platform. It wasn’t bad, but it required constant internet access and had a small working window with few shortcuts, making mapping slow. My captain, Aikiriza Justus (OSM name), had a vision of teaching us how to use JOSM and become “advanced mappers.” He guided and pushed us beyond our limits through various Google meetings, preparing us for the Africa Map Cup 2026, which began on 7th February 2026. “Stay tuned for the next part of my Africa Map Cup journey…”
Below I will outline improvements for data interoperability regarding Wilderness Study Areas in the United States: https://en.wikipedia.org/wiki/Wilderness_study_area
| Wikidata Infobox template: {{Wikidata Infobox | qid=}} |
Wikidata Queries: *https://w.wiki/MHst - Recreation.gov Gateway IDs with/without OSM identifiers *https://w.wiki/MJvN - Recreation.gov POIs *https://w.wiki/MLBD - Wilderness Connect IDs accompanied by WDPA, Recreation.gov Gateway; OSM identifiers
A few days ago, I asked the community about converting general GIS polygons into OSM multipolygon relations. I’ve searched online but haven’t found a workflow that fits my needs. Specifically, I am looking for a way to handle three different levels of administrative boundaries where adjacent areas share a single boundary line connected via a relation.
My question on the OSM forum is still awaiting a solution: Link
However, someone from my local community mentioned that what I’m looking for is “topology.” While that is a broad GIS term, they clarified that TopoJSON is a specific format designed for this. There are many converters available to turn GeoJSON into TopoJSON.
Interestingly, I found that someone opened a ticket for a TopoJSON converter in JOSM back in 2020, but it hasn’t received a response yet: Link
I’m planning to update and expand the administrative boundaries for Bali in OSM. I’ve already prepared the multipolygons for admin_level 5, 6, and 7 using single shared ways for efficiency. By leveraging Google Sheets, I’ve also compiled a comprehensive list of Wikidata, Wikipedia links, and multilingual names to better serve Bali’s international profile.
However, the conflation process is proving to be a challenge. The existing data is quite a “nightmare” to clean up; many roads and waterways are currently shared with administrative relations, and landuse or natural features are glued to the boundaries. Time to start untangling!
O víkendu jsem se vydal na malý výlet vlakem. Nastoupil jsem do vozu GW Train, který mne vezl až do Horní Plané u Lipna. Jedu s tímto dopravcem poprvé a je to všechno v pohodě. Těším se na vycházku a výstup na rozhlednu Dobrá voda.
Posadím se a hned si všimnu, že na stěně vozu je uchycena široká obrazovka infopanelu. Ukazuje aktuální stanici a v druhé části obrazovky je vyobrazena mapa s pohybujícím se bodem na trati.

Vlak projíždějící Českým Krumlovem, foto Aktron, CC BY-SA 4.0
Ani nemusím jít blíž, abych rozeznal, že ta mapa je OpenStreetMap a že mě toto malé objevení udělalo radost. Je to jedna z mnoha praktických použití mapy, která nemusí být jen na počítači, nebo v mobilu.
Při výletu po Horní Plané si všímám dalších nových detailů a zajímavostí ve městě. Horní Planou jsem před časem mapoval. Teď si ji konečně prohlížím naživo.
Memetakan batas administrasi di Indonesia bisa jadi cukup rumit, terutama saat menghadapi nama wilayah yang serupa. Berikut adalah alur kerja (workflow) sederhana saya dalam menyiapkan data tersebut:
Pertama, unduh data spasial resmi dari Peta Rupa Bumi oleh Badan Informasi Geospasial (BIG) atau mencari di Satu Data Indonesia. Data ini berfungsi sebagai sumber geometri utama.
Karena data sumber berbentuk poligon, saya menggunakan QGIS untuk mengekstrak titik tengah (centroid). Titik-titik ini penting untuk membuat tag place=* yang mewakili pusat dari tiap wilayah administrasi.
Poligon tersebut mencakup kode referensi Kemendagri. Kode ini sangat vital untuk:
Konflasi: Memastikan data cocok dengan set data lainnya.
Identifikasi: Banyak desa (admin_level 7 atau 8) memiliki nama yang sama. Kode ini membantu membedakannya dalam satu Kabupaten atau Provinsi.
Menggunakan alat spreadsheet dan teknik konflasi, saya mencocokkan data untuk menambahkan:
Tag wikidata dan wikipedia.
Nama dalam berbagai bahasa (name:en, dsb).
Sesuai dengan praktik terbaik (best practices) di OSM, saya mengubah poligon menjadi garis terpisah (polylines).
Hal ini memungkinkan wilayah yang bertetangga untuk berbagi satu garis batas yang sama melalui relasi multipolygon.
Setelah dikonversi, saya mengekspor hasilnya dalam format .geojson.
Terakhir, saya menggunakan titik lokasi (place nodes) yang telah diekstrak sebelumnya untuk menyalin dan menempelkan tag yang relevan ke dalam relasi multipolygon baru di editor OSM.
Mapping administrative boundaries in Indonesia can tricky especially when dealing with overlapping names. Here is my simplified workflow for preparing this data:
First, download the official spatial data from Peta Rupa Bumi by Badan Informasi Geospasial or searching it in Satu Data Indonesia. This serves as the primary geometry source.
Since the source data is in polygon format, I use QGIS to extract the centroids (points). These points are essential for creating the place=* tags that represent the center of each administrative area.
The polygons include Kemendagri reference codes. These are vital for:
Conflation: Ensuring data matches across different sets.
Identification: Many villages (admin_level 7 or 8) share the same name. The code helps distinguish them within a Regency or Province.
Using spreadsheet tools and conflation techniques, I cross-reference the data to add:
Wikidata and Wikipedia tags.
Multilingual names (name:en, etc.).
To follow OSM best practices, I convert the polygons into independent ways (polylines).
This allows adjacent areas to share a single boundary line via a multipolygon relation.
Once converted, I export the result as a .geojson file.
Finally, I use the previously extracted place nodes to quickly copy and paste the relevant tags into the new multipolygon relations in my OSM editor.
Comme ailleurs dans le monde, les installations photovoltaïques se multiplient en Belgique. En 2022, 68 ans après les débuts du photovoltaïque, la capacité mondiale en panneaux photovoltaïques atteignait son premier TW. Il n’aura fallu que 2 ans pour que 1 TW supplémentaire soit ajouté en termes de capacité mondiale en 2024. Et le rythme s’accélère encore.
En Belgique, d’après electricitymaps, il y aurait une capacité installée de 11.5 GW, soit environ 1 kW par habitant, une puissance à peu près équivalente à la charge électrique moyenne du pays. Toutefois, difficile de trouver des chiffres précis, à jour et encore moins la répartition spatiale de ces installations.
Récemment, je vois passer l’info que l’équipe du géoportail wallon travaille justement sur un inventaires des installations photovoltaïques au sol. Du coup, j’en ai profité cette semaine de faire un tour des centrales solaires de Wallonie (la moitié sud de la Belgique) enregistrées dans OSM, en vérifiant les données et les complétant. J’ai même découvert et ajouté quelques centrales photovoltaïques.
Il y a une très grande diversité d’installation photovoltaïques: depuis le panneau isolé sur un balcon ou la toiture d’une maison, jusqu’à la centrale solaire photovoltaïque de plusieurs MW, composé de milliers de panneaux. Dans OSM, on distingue d’une part les centrales solaires et d’autre part les panneaux solaires. Les centrales solaires photovoltaïques sont constituées d’un ensemble de panneaux, tandis que les petites installations sont composés uniquement de panneaux.
Dans OSM, on ajoute une centrale solaire avec les tags “power=plant” + “plant:source=solar” + “plant:method=photovoltaic” + “plant:output:electricity=*” (voir le wiki osm.wiki/Tag%3Aplant%3Asource%3Dsolar). On dessine généralement une surface qui englobe les panneaux, qui sont plus ou moins espacés selon les cas, et uniquement pour les “grosses” installations.
Люди, кто пишет в дневниках: вот, я стал картографом,..мне это всё понравилось,…ура ура ура… Большая просьба: не превращайте только карты в игру для развлечений! Не вносите правки и не присваивайте имён, если вы Лично не проводили исследования в данном районе! Надеюсь что большинство прочитавших всё-таки поймут меня.
Es macht besonders Spaß, draußen an der frischen Luft zu kartieren. Gerade jetzt, wo es wieder wärmer wird, ist das durchaus eine angenehme Art zu mappen. Doch das wäre ohne bestimmte Tools gar nicht möglich. Da dein Smartphone selbstverständlich um einiges kleiner als ein PC-Bildschirm ist, ist es wichtig, die richtigen Tools auf dem Handy zu haben, um den Überblick zu behalten und effizient arbeiten zu können. Doch welche Apps eignen sich für dich? Und überhaupt: Welche Apps gibt es da eigentlich?
Um StreetComplete kommst du nicht drumrum. Es ist einfach zu bedienen, schön gestaltet und vor allem gamifiziert. Und genau dieser zugrunde liegende spielerische Ansatz macht die App so gut. Statt die Tags manuell für Objekte einzutragen, sucht die App nach fehlenden Tags, die du dann durch die Beantwortung einer Frage hinzufügen kannst. Zudem gibt es Abzeichen, Statistiken und Rankings, die dich motivieren weiterzumachen. Meiner Meinung nach macht die App aber auch ohne diese schon süchtig genug …
SCEE ist prinzipiell eine abgewandelte Version von StreetComplete. Ihr Ziel ist es, die App auch für dich als etwas fortgeschritteneren Mapper zugänglich zu machen. So lassen sich Tags anzeigen und bearbeiten, mehr Fragen zu spezielleren Tags aktivieren und diese sogar leicht modifizieren. Ich persönlich nutze dieses Tool hauptsächlich, da es für mich den besten Kompromiss zwischen Übersichtlichkeit bzw. schönem Design und tieferem Mapping bietet. Wichtig zu wissen: Du findest diese Version meist nicht im Play Store, sondern musst sie über F-Droid oder GitHub beziehen.
Mapping Banjë, Albania
I started mapping the Banjë region in Albania by setting up my editing environment in JOSM.
I configured JOSM with a set of plugins to support structured mapping and validation:
I also explored additional plugins like contour-related tools for terrain-based mapping.
The focus area is Banjë (central Albania) — a landscape with:
- Complex terrain (valleys, rivers, slopes)
- Mixed land use (forests, agriculture, settlements)
- Incomplete or inconsistent OSM coverage


