
想着5号线开通一个月了,就突然联想到一年前我立下的目标(osm.org/user/xhzyh1/diary/393836)。
然后还没完成……不过还算有进程。链接:osm.org/#map=15/31.3034/120.8217
一年前这里还是一片没什么数据的地方,现在已经看上去比较好了。现在也是忙东忙西,想起来就做一点,所以进展过慢hhh。
 OpenStreetMap
想着5号线开通一个月了,就突然联想到一年前我立下的目标(osm.org/user/xhzyh1/diary/393836)。
然后还没完成……不过还算有进程。链接:osm.org/#map=15/31.3034/120.8217
一年前这里还是一片没什么数据的地方,现在已经看上去比较好了。现在也是忙东忙西,想起来就做一点,所以进展过慢hhh。
Здравствуйте! Мне очень приятно принять участие в команде “OpenStreetMap”. Надеюсь у меня хватит сил и энтузиазма, принять участие в работе остальных участников этого проекта, как можно на большее время.
After recently moving to the area I’ve found myself with the need to go out and do some GPS traces. A small sushi bar is what pushed me to go find out more about my local area and I found several shops that haven’t been mapped yet that I plan on adding, perhaps when it isn’t raining so hard.
I’ve learned quite a bit over the last few weeks, so I’m re-doing some of my earlier entries.
Notes for self and others: Based on local knowledge I’ve been able to determine that the PEMA ortho images are newer than the NYS Orthos, but not by much; these are both newer than Mapbox, but Mapbox is higher resolution/clearer.
both PEMA ortho and NY Ortho appear to be positioned pretty well in the Great Bend area, but Mapbox needs to be adjusted.
ESRI world seems to use the NY Ortho in this area and their positioning is shifted slightly to the north relative to the PEMA and NYS Orthos, but it seems to be registered fairly well overall. I would tend to believe ESRI in general, but the state Orthos may be better aligned for this area. Either way, it’s a negligable shift.
Bing: don’t bother; horrible for this rural area.
Can’t tell the vintage/date for the USGS 3DEP DEM model in this area. There is a much higher resolution Lidar dataset on the USGS website.
I’ve now been editing Oxford, Ohio for over a year, with more than 15,000 edits in the area and only a handful elsewhere. I figured it was finally time to set a proper goal for my editing: “complete” Oxford by the end of May 2022. For now, “complete” refers to mapping all the buildings, highways, POIs, and landuses, with perhaps some nuance. The details for each of these:
By my count, there’s 7 neighborhoods/groups of houses left to map. That’s the most significant improvement from when I started a year or so ago, when we probably had around four or five neighborhoods mapped and only half of the downtown/uptown area. After those, there’s just a scattering of buildings on the outskirts of Oxford left. This phase of the project is nearing completion.
I have five goals for highways currently:
A number of paths are vehicle-accessible but aren’t labeled as such. I’m not sure what the proper tagging for those is, so figuring that out is the first step here.
Easier said than done, or so I hear. tiger:reviewed=no is still on most roads in Oxford. I’ll need to do some research as to what TIGER tags should be kept or removed and such. I imagine the zip tags aren’t too useful.
There’s lots of sidewalks around Oxford. I’ll probably map these separately, with crossings. That shouldn’t be too hard, but will take a good bit of time.
I’m not sure about how much work there will be to do here, but I want to check up on things like the turn restrictions and traffic lights on all the intersections around Oxford. Some of this might be survey work.
There aren’t tons of these, but where they exist they’re very inconsistently mapped. Some work will need to be done to bring these up to standard.
The other day a new user was asking questions about mapping the new development of the former Royal Engineers Barracks opposite Mill Hill East tube station. I’ll write about their problems with postcodes another time.
However, this prompted me to look at the OSM map of the area, which I knew well in the 1980s. I was a PhD student in Central London (UCL), but a close friend was doing his doctorate at (NIMR](National Institute for Medical Research), and I visited fairly frequently. Over time I got to know other scientists & staff at NIMR, not least because I became an active member of the walking group which was part of the staff club (NIMROD, which still leaves a trace on OSM), but also because of scientific collaborations.

El domingo 8 de agosto, día aniversario 17 de OpenStreetMap. A las 10am (GMT -5) tendremos la oportunidad de mapear juntos.
Habrá un mapatón global por el 17 aniversario de OSM el domingo 8 de agosto:
AQUÍ LAS SESIONES HORARIAS POR PAÍS, PARA CONVIVIR: osm.wiki/Foundation/Local_Chapters/OSM_17-hour_Global_Mapathon.
Los proyectos para mapear México se propusieron temáticas: ríos en zonas inundables del país (índice municipal de CENAPRED) y picos de montañas.
Estén pendientes.

Perumahan Graha Tenggela Indah, Blok C, No. 7, Desa Tenggela Kecamatan Tilango Kabupaten Gorontalo.
I Live here….
L’IGM è l’Istituto Geografico Militare, ed è l’ente cartografico dello Stato italiano. Disegnano carte dell’Italia di vari tipi (topografiche, corografiche, geografiche) e in varie scale (dalla 1:25000 alla 1:1000000), e queste carte compongono, appunto, la cartografia IGM. A volte sono un po’ vetuste (la carta topografica 1:25000 della mia zona non viene aggiornata dal 1955!) ma sono di una precisione incredibile, e contengono un sacco di informazioni che è difficilissimo trovare altrove, come i toponimi locali (case sparse, aggregati rurali, ecc.), i torrenti, le sorgenti d’acqua, ecc. Non sarebbe bello riportare queste informazioni in OSM?
(e probabilmente anche in JOSM, che non amo particolarmente)
L’IGM non mette a disposizione un tile server per la propria cartografia: non solo le loro mappe sono a pagamento, anche in formato digitale, ma ve le danno in un formato tremendo (TIFF con un file a parte con le informazioni di georeferenziazione, cioè vi dovete arrangiare), e comunque le considerano sotto copyright nonostante siano il prodotto di un ente pubblico. Per fortuna, il Ministero dell’Ambiente è un po’ meno rompicoglioni: dal loro Geoportale Nazionale danno accesso alla cartografia IGM non solo dietro licenza CC BY-SA 3.0, ma soprattutto tramite protocollo WMS, che è supportato da iD
Il Geoportale Nazionale fornisce decine di layer come servizi WMS: uso del suolo, bacini idrografici, rischio sismico e alluvionale, ecc. Ma quello che ci interessa ora è “Cartografia di base - IGM 25.000” (sono anche disponibili le scale 1:100.000 e 1:250.000, ma non sono utili perché OSM si può considerare completo a quelle scale). Il Geoportale Nazionale ci dice che l’URL del servizio è:
http://wms.pcn.minambiente.it/ogc?map=/ms_ogc/WMS_v1.3/raster/IGM_25000.map
Részleteket lásd:
https://wiki.osm.org/wiki/Hungary/20210809
Kezdés előtt ki-ki igény szerint például POI-kat frissíthet a környéken.

uploaded a public path through Great Hollanden to avoid walking on Riding Lane on way to Hildenborough station.
Ст. Микуличин
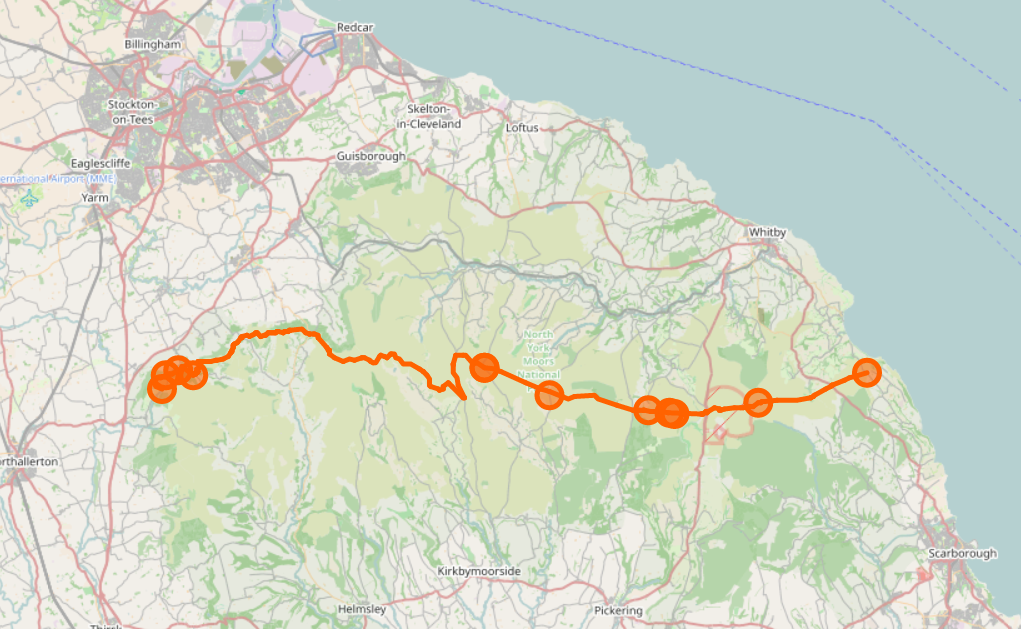
Previously I wrote about checking National Parks in Britain and Ireland for breakage, by counting the number of valid polygons in a rendering database.
A similar approach can also be used to check line features as well as polygons. It’s possible to count the number of contiguous sections of a given polygon. For example, here’s the Lyke Wake Walk, which is in one piece:
psql -d gis -c "SELECT count(*) FROM planet_osm_line WHERE (osm_id = '-1996318');"
 count
-------
     2
(1 row)
and here is the Sabrina Way, which isn’t:
psql -d gis -c "SELECT count(*) FROM planet_osm_line WHERE (osm_id = '-537430');"
 count
-------
    12
(1 row)
If something is changed in OSM that introduces an extra piece, or fixes a gap, that number will change. This script can be used to count the change in the number, like this:
Change in relation components for Sabrina_Way 537430
3c3
<     12
---
>     13
The City of Fremantle has new speed limits, mostly 40km/h. I’ve been trying to get the map up to date. They provide a bit of a map (archive), and I’m checking against the new signs as they go up. I don’t know why they don’t care about what happens west or north of the railway line.
I normally don’t really care about vehicle speed limits, because I don’t drive, but this was an interesting exercise in JOSM filters and non-geometric mapping.
Another short post on street furniture (you can definitely tell I haven’t got out much in the pandemic as this is the sort of mundane detail I’m focused on at present). Once again these are, as much as anything, notes for myself.
The Ranty Highwayman wrote a great detailed post about the different types of tactile paving and how they should be used in the UK: https://therantyhighwayman.blogspot.com/2015/02/tricky-tactiles.html. It’s very helpful if confused about the various types, and may help to spot incorrect layouts (which can be tagged).
My only additional contribution is to note that in the UK the tactile paving slabs tend to come in a very restricted set of sizes:
More examples of tactile paving can be found on suppliers’ sites such as this one.
So far, so unbelievably nerdish, but there’s a nifty bit of knowledge from this info which can be applied to mapping much more widely! Knowing the paving slab sizes makes it easy to estimate the width of pedestrian crossings, crossings at dropped kerbs and any pavement/sidewalk where the corduroy hazard slabs are used. This can not only provide a simple way to survey widths without using a tape measure or laser device, but can also assist in estimating widths based on experience.
This blog post is a version of my recent SOTM 2021 presentation on the OpenStreetMap Standard Layer and who’s using it.
With the switch to a commercial CDN, we’ve improved our logging significantly and now have the tools to log and analyze logs. We log information on both the incoming request and our response to it.
We log
We log enough information to see what sites and programs are using the map, and additional debugging information. Our logs can easily be analyzed with a hosted Presto system, which allows querying large amounts of data in logfiles.
I couldn’t do this talk without the ability to easily query this data and dive into the logs. So, let’s take a look at what the logs tell us for two weeks in May.
Bei einer kleinen Radtour entlang der Autobahn-Baustellen bin ich auf ein paar ‘interessante’ Schilder der Autobahnmeisterei gestoßen.

Die Lotsenpunkte sollen den Baustellenfahrzeugen (und eventuell später auch Einsatzkräften?!) helfen, einfacher an den Zielort zu kommen. Als hätte Andi nicht schon genug Geld verschwendet, scheint jetzt auch noch Geld in W3W zu fließen :-(
Over time I’ve noticed features appearing on highways & paths which are unusual and which I don’t know how to describe. Often these become much more prevalent. Recently I made an effort to do some reasearch on a couple of these and learnt some useful terminology (documented here so I don’t forget):
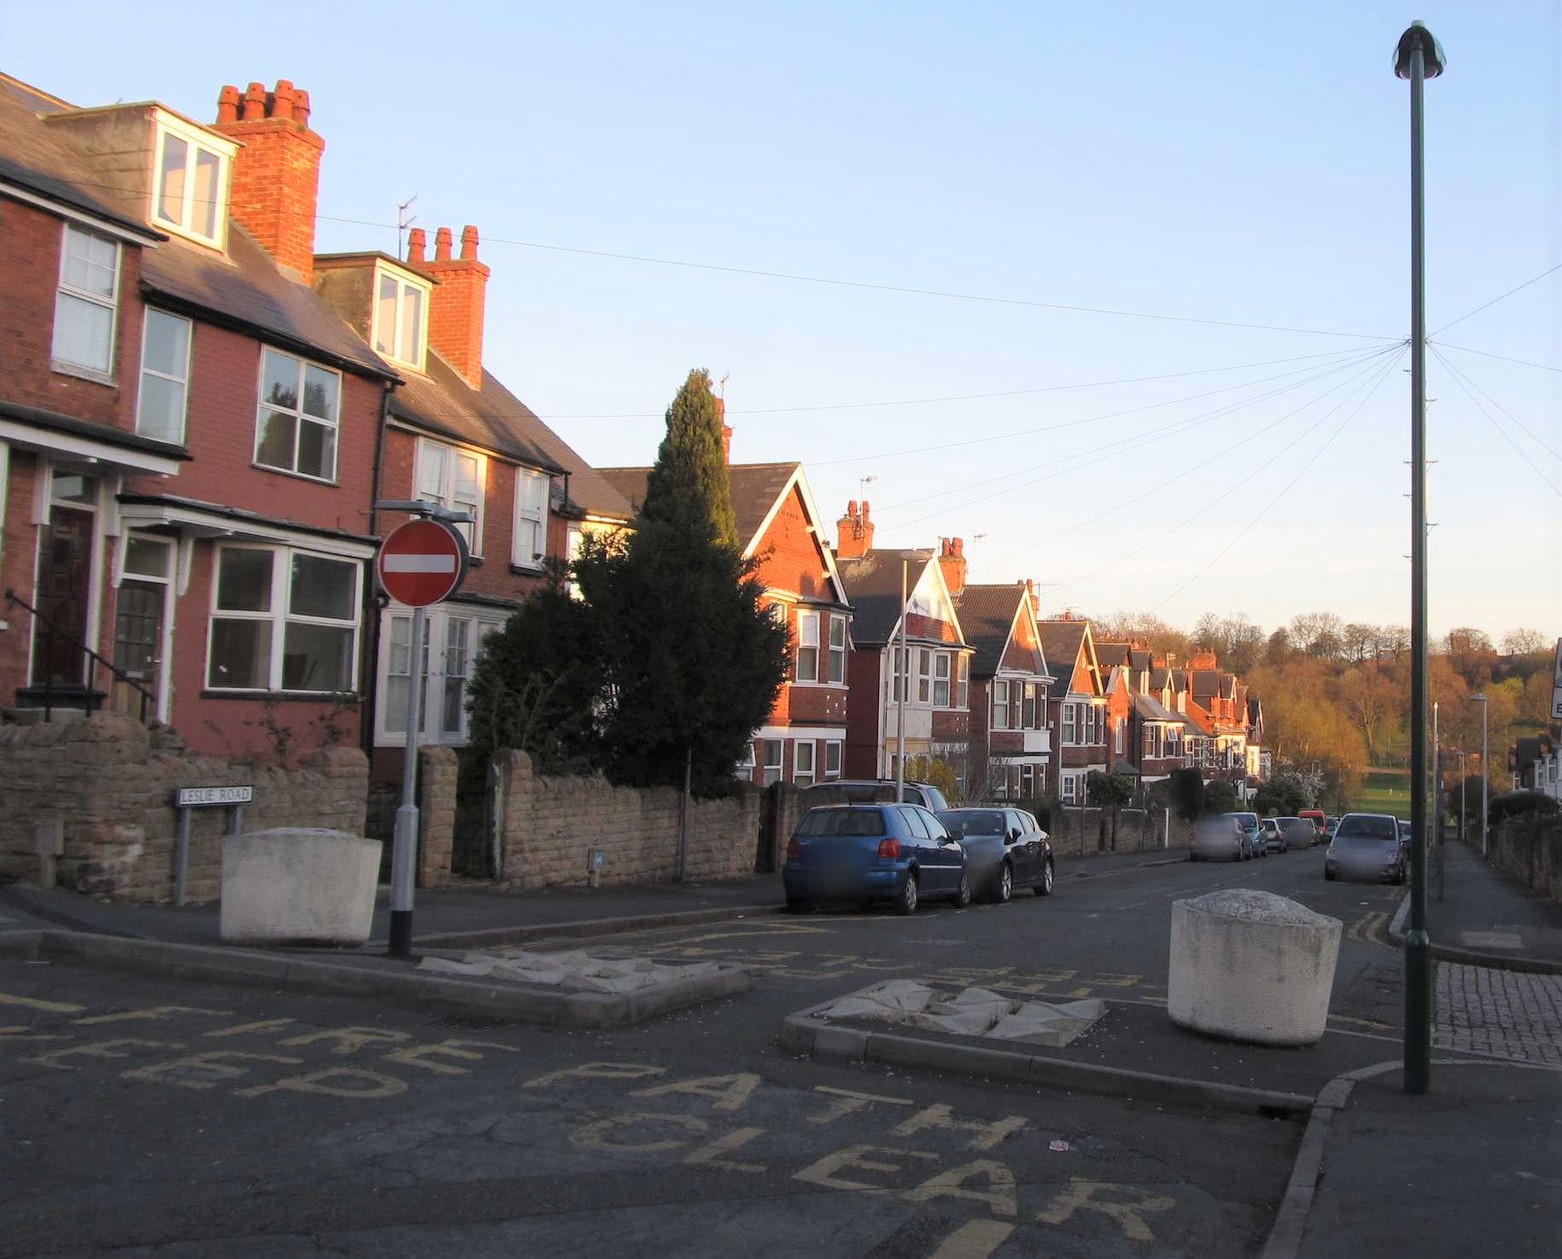
There is quite a wide range of different types, some aimed more at stopping pedestrians. The presence of deterrent paving may represent a significant hazard for people with reduced mobility or impaired sight.


