 OpenStreetMap

MCA office building
Users' Diaries
Recent diary entries
Posted by Atikur Rahman atik on 21 April 2021 in English.
Last updated on 8 May 2021.

Highway mapping is a big confusing thing for most mappers. This is more difficult for those who are new or not connected to the local community. Because, when are adding or mapping local highway information in the Openstreetmap suddenly they found that the local government has one highway classified system and the other side OpenStreetMap has a different classification system. So most of the time they avoid adding roads or did “road = unclassified”. In addition, many times when there is an emergency or remotely mapping highways from different countries they also inadvertently give wrong information. Because they always follow the OpenStreetMaps classification. And it makes a conflict.
So the Local community creates a Highway tag list which is based on the Government’s existing system.
If anyone wants to map by following that tag, he should follow that list or if he wants to do it in JOSM, he can easily draw the highway by adding BD_Highway_tag from JOSM’s preset preference.
How to add the presets:
- First, open the JOSM.
- Then click presets preferences from the top menu. (it will open a toolbar.)
- Then find out the “BD_Highway_tag” presets. (If it not showing on the list then just click the reload icon)
- Then add it on active presets.
- After that click OK.
Now it will be showing in the Active presets list.
Posted by Hungerburg on 20 April 2021 in German (Deutsch).
Last updated on 27 April 2021.

Ein interessanter Wikipedia Artikel wurde auf der Seite zu einem umstrittenen Proposal zitiert - https://en.wikipedia.org/wiki/Royal_forest - Leider nur auf Englisch, hier aus der Einleitung:
In England ist ein Reichsforst (royal forest), gelegentlich Königswald genannt, eine Fläche die nicht der landschaftlichen Gerichtsbarkeit unterliegt. Das Wort leitet vom lateinischen “foris” her, das mit “draußen” übersetzt wird. Im England der Anglo-Sachsen (~500-1066) hat es solche Bereiche nicht gegeben, erst die Normannen (ab 1066) haben diesen Brauch eingeführt. Dabei ging es in erster Linie darum, Wild für die herrschaftliche Jagd zu reservieren. Die pflanzliche Grundausstattung der Gegenden spielte eine Rolle nur dieses Zieles wegen. Für die Einheimischen war es keine frohe Botschaft, wenn das Land auf und von dem sie lebten zum Reichsforst erklärt wurde. Die Praxis, der nachgesagt wurde, dass sie für verbrannte Dörfer und Entvölkerung zeichnete, wenn auch im Ausmaß gewiss nicht wie behauptet, verebbte Mitte des 17. Jahrhunderts, die Bezeichnungen überleben bis heute.
Aus meiner Hobbymapper Perspektive: Hier in der Gegend gab es zu Zeiten der Monarchie einen Reichsforst - ein forstwirtschaftlich unergiebiges felsiges Steilgelände, aber gut zur Gamsjagd. Geerbt haben das die Bundesforste - ein vergleichsweise umgänglicher und verständiger Waldbesitzer. Förster kennt man hier keine, die heißen seit der frühen Neuzeit Waldhüter, ganz offiziell inzwischen Waldaufseher. Ums Wild kümmern sich Jäger.
Mit Ausnahme von administrativen Bezeichnungen (Forstamt) ist das Wort Forst hierzulande das Gegenteil von geläufig. Trotzdem sind genau hier, wo laut amtlichen Daten nicht ganz zwei Drittel des Waldes im forstwirtschaftlichen Ertrag stehen, 99% des Waldes in der OSM als Forst kartiert, was eben genau das aussagen soll, dass dem so sei. Das stinkt zum Himmel.
Update: Hierzulande (österreichisches Bundesland) gibt es scheints zwei Ebenen der Forstorganisation:
Posted by Hungerburg on 19 April 2021 in German (Deutsch).
Last updated on 13 May 2021.
Ein in Abstimmung befindliches proposal beinhaltet, dass die Kennzeichnung von Waldflächen mit “landuse=forest” als veraltet gelten soll. In deutschen Landen wird die allerdings gerne dafür verwendet, um Waldflächen nach ihrer wirtschaftlichen Nutzung zu unterscheiden. So liest man jedenfalls. Im deutschsprachigen Forum hieß es dementsprechend vor Kurzem wieder einmal: 95% des Waldes in D/A/CH sind seit hunderten von Jahren Nutzwald, gehören also mit “landuse=forest” getaggt. Woher stammt diese Zahl?
Aus den Daten der openstreetmap selbst? Im OHSOME Dashboard lassen sich Flächen von Wald (natural=wood) und Forst (landuse=forest) ausgeben. Die sind mit Taschenrechner schnell in Anteile umgelegt. Deutschland liegt mit 97% Nutzwald nicht weit von 95, Österreich mit 99,2% allerdings ordentlich daneben, die Schweiz mit 95,6% schießt den Vogel ab. Alles klar! Genauer als die Deutschen sind eben nur die Schweizer, die Österreicher können den beiden das Wasser nicht reichen, die können nicht einmal Daten richtig erfassen. So könnte man meinen.
In Österreich gibt es nun die Österreichische Waldinventur, eine amtliche Stelle, die genau diese Daten erhebt. Ihr zufolge sind in Österreich aber nur 83% des Waldes Ertragswald, will heißen, für die Holzgewinnung genutzt. Besonders eklatant fällt das in einem westlichen Bundesland auf, die Ertragswaldquote laut ÖWI liegt dort bei 65,4%, laut OSM dagegen bei 98,8. Das liegt ja noch weiter auseinander!
In diesem westlichen Bundesland gibt es zu unserer Freude auch ein öffentlich zugängliches Geoinformationssystem. Luftbilder und anderes lassen sich als Hintergrundebene in JOSM einblenden. Vielleicht lässt sich damit mehr über die Differenz erfahren? Hier ein paar Bildschirmfotos von der “Suche nach dem verlorenen Wald”, mögen es vier Prozentpunkte sein, oder 33.
Die folgenden Bilder zeigen Ausschnitte in denen die OSM-Carto Standardansicht mit Daten des Landes überlagert wurden.
As one of my efforts to improve the mapping of heritage features in Ireland, i started a proposal to be able to map mass rocks recently. I thought they were only “a thing” in Ireland until yesterday, when my aunt in Germany shared a photograph of the hilltop of the Sonnenstein on WhatsApp. In front of the massive cross that she probably tried to take the picture of, I discovered a boulder that looked suspiciously like a mass rock, but I could find no information online about it and it is only mapped as natural=stone. The area around that hill is a Catholic enclave in what is really core Lutheran country. So I sent an email to the tourism office of that parish/ area, asking whether they knew if it was a mass rock (which I translated as Altarstein in my email). I just got a reply from them (I’m still waiting to hear back about an email I sent 3 weeks ago to the Bishop of Ossory about holy wells) today and my suspicion was confirmed. It was put there in the 1950s (so under communist rule, when religion was frowned upon, to say the least) and is still used.
I’m very excited and I hope my proposal gets approved, so I can map this mass rock.
%20by%20Vince%20Emond.jpg)
If I had 60 minutes to save the world, I would spend 55 minutes defining the problem and 5 mins solving it - Albert Einstein
Whichever version you have heard of the quote above, be it Einstein, Lincoln or others, they speak to a very critical aspect of tech development. Being clear about a problem (or six), will more likely lead to a useful solution. It is for this reason, that before the team at hot_tech starts ‘solutioning’, we must deeply understand the pains and problems that plague our space.
Further boiling down our findings from our Design Sprintathon posted last week and sharing more of our learnings over the last year as we engage deeper with the HOT and OSM collectives, the following post is a reduction of many conversations into what hot_tech sees as the most rich and flavourful version, from the source.
The list below is a summary of the full list here for comment. It is by no means an exhasitive list of all problems that exist, nor it is a hierarchy of which problems are more important than others. Rather, it is a list compiled of the voices we heard and what they told us was important to them. It is a list of causes and effects of pains and problems that our team desires to explore further and contribute to easing. By seeking relievers for these pains and problems, hot_tech feels we can either enable or amplify the work of those that choose to use our products as a means to meet their ends. We don’t expect our solutions to be silver bullets, nor do we feel we are the only group who can do it, but these are the problems we feel we can make both valuable and meaningful contributions toward resolving.
After reading this list, we encourage two things:
- Reflect on it and ask ‘does this problem resonate with you?’
- Provide feedback either in the comments here, or in this document directly.
I use this tool a lot with the shortcut ‘T’
It cuts ways and selects the element that needs new/different tags.
Thanks to Simon Legner who wrote it. https://github.com/JOSM/auto-tools#knife-tool
Posted by tukangsampat on 19 April 2021 in Indonesian (Bahasa Indonesia).

Saya rasa lima tahun saya tidak menulis diari atau tulisan di OpenStreetMap. Sejak tiga tahun belakangan saya lebih banyak menulis artikel di blog mengenai bangunan bernama Setiap Gedung Punya Cerita. Blog ini benar-benar menarik bagi anda pecinta sejarah arsitektur, jadi cobalah untuk mengunjunginya, semoga menjawab penasaran anda mengenai bangunan tinggi dan juga gedung-gedung menarik, atau biasa saja, atau membawa memori masa lalu anda. Blog SGPC ini juga menggunakan tagging peta OpenStreetMap karena OSM itu lisensinya terbuka dan fleksibel dibanding peta-peta populer seperti Google Maps (pelit amat lu paman Google).
Oke, tulisan ini mengajak “anak rebah”, “anak meme” dan masyarakat umum untuk berkontribusi lewat OpenStreetMap. Bagaimana caranya? Penulis rasa sederhana sekali ya, cuma entah bagaimana, orang-orang pada pakai Google Maps dimana aturan hak ciptanya bikin nyebelin pengguna lain (dengan anda memasang tag di peta, berarti ilmu geografi anda sendiri digadaikan ke Google, bukan ke sembarang orang).
Gimana caranya ya?
Kalau anda pakai komputer PC atau laptop, ini caranya:

_
Posted by brik2shnoupeaxjola on 18 April 2021 in French (Français).

Ajout d’un ancien arrêt de bus, modification des propriétés d’une rue résidentielle, application des attributs recommandées pour deux arrêts de bus et enfin ajout d’un bâtiment.
Groupe de modifications : #103136686 .

https://umap.osm.ch/en/map/open-table-tennis-switzerland_3307
Tjoho. 4000 it is.
I change the search pattern once again. There is a OGD dataset called SwissNAME3D which I filter in QGIS by “OBJEKTART” = ‘Schul- und Hochschulareal’. Then I use the Go2nextfeature3+ plugin to scroll through all these kind of schools just to look for table tennis tables. As today I passed 1200 of about 10400 school objects in that database. So expect some more TTT to come. :-)
Posted by Pieter Vander Vennet on 17 April 2021 in English.

A bit over a year ago, I received a phone call: We would like to have some project about nature and forests, where people can like go out and add data about those. Oh, it has to be really simple to use.
Some months and some funding later, the first version of MapComplete was born. While it had a specific focus then, it has grown a lot. Today, MapComplete is a map viewer for a certain theme, where the configuration for that theme decides what features are visible with which icons. When a map feature is clicked, known information is shown and the user is invited to add more information and to add pictures.
By now, there are about 20 themes for multiple topics, such as bicycle shops and pumps, playgrounds, public bookcases and much more. And it is relatively easy to create and load your own theme.
The ease of use and flexibility has lead to a steady increase of contributors that way. Thursday 15th of april was the day the editor saw its 500’th contributor:

Posted by nukeador on 16 April 2021 in Spanish (Español).

Esta es una continuación de mi anterior post de presentación del estudio.
En Humanitarian OpenStreeMap Team (HOT) queremos utilizar mejor nuestros recursos para apoyar el movimiento más amplio de Apen mapping humanitario. Por eso estamos llevando a cabo un estudio para entender cómo apoyar a los colaboradores y a las comunidades en países con necesidades humanitarias, de desastre o de desarrollo.
En este post resumiré lo que ha ocurrido en el primer trimestre (Q1) de 2021, lo que hemos aprendido y el plan para los próximos 3 meses (Q2).

Nuestro objetivo y los principales resultados del primer trimestre fueron los siguientes
Se ha puesto en marcha el trabajo de investigación centrado en las necesidades globales/compartidas.
This is a follow-up of my previous post presenting the research work.
At Humanitarian OpenStreeMap Team (HOT) we want to better use our resources to support the wider Humanitarian Open Mapping movement. That’s why we are running a research project to understand how to support contributors and communities in countries with humanitarian, disaster or development needs.
In this post I’ll summarize what happened in the first quarter (Q1) of 2021, what we learned and the plan for the next 3 months (Q2).
Our goal and key results for Q1 were:
Foundational work for the research with focus on global/shared needs is kick-started
- Stakeholders are aligned on scope of the work
- A set of prioritized core/global questions and unknowns is delivered
- Initial exploration of potential data sources is delivered
- A plan for Q2 is shaped by the insights and learnings gathered
You can see more details on on the public project brief.
Q1: Focus on global questions
Posted by cricri on 16 April 2021 in French (Français).
Last updated on 3 February 2024.
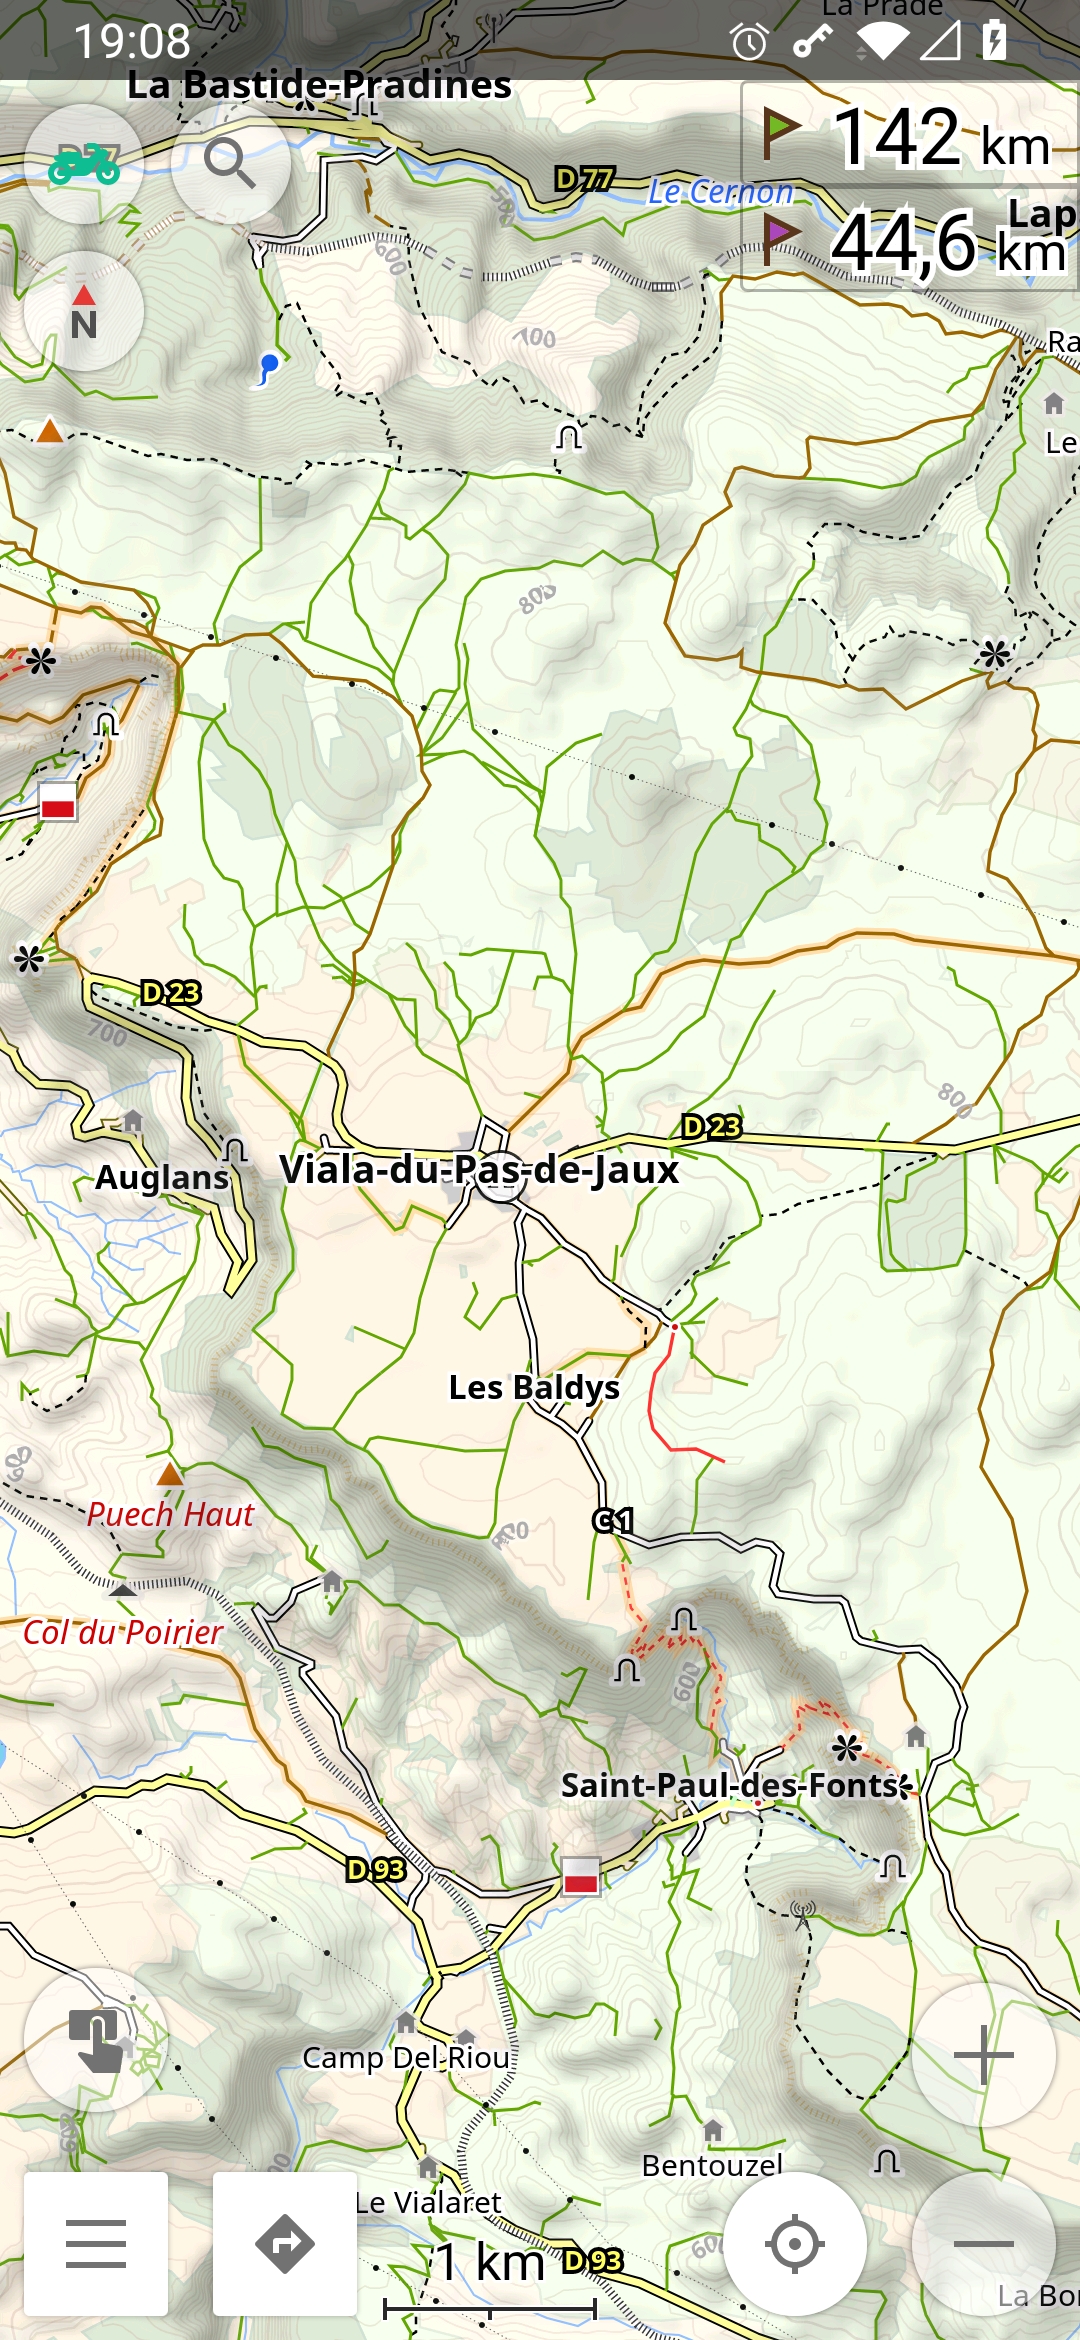
inspiré des cartes IGN 1/25000, balisages symboles Français interdictions motorisés, zone protégées.
en plus 3 fichiers de routage selon le véhicule.
le détail est là: https://github.com/OsmAnd-Rendering/Motorcycle/blob/main/README.md
ça ressemble à ça
Posted by brik2shnoupeaxjola on 16 April 2021 in French (Français).
Ajout de l’ancien Bowling de Carquefou, “Bowling de l’Erdre”, qui a fermé définitivement depuis peu.
Ajout également de plusieurs champs agricoles autour de Carquefou.

–
Posted by bkil on 15 April 2021 in Hungarian (Magyar).
Last updated on 16 April 2021.

Figyelem, ez kedden lesz!
- Közvetítés: https://bbb.grin.hu/b/osm-276-9x9
További információk a Wiki oldalon lesznek olvashatók:
Javasoljuk, hogy aki jelentkezik erre az eseményre, lépjen be az OpenStreetMap-Hungary GetTogether csoportba és állítson be email címet, hogy értesüljön a jövőbeli eseményekről is.
Bonjour, je suis nouveau sur le site, et j’essaye de me familiariser avec son interface ainsi que les choses qui sont possibles de faire.
สวนพอใจไอดิน เกษตรอินทรีย์ บ้านหนองเอี่ยน อ.คำชะอี จ.มุกดาหาร