Users' Diaries

Recent diary entries

As I’m not yet sure what will be included in the alpha version of the damn project, I’m getting inspired. This time by Tanga Building Footprints Import announced on the imports mailing list.

It looks like the buildings are already imported in the Tanga city, e.g. this one, but I’ve never done the import thing, so I can’t say.

In this diary, I’m going to introduce the example mapping workflow with the prepared data based on Tanga Building Footptrints Import using the damn project. Not everything is yet fully automated, so this diary is more like describing the proof of concept. However, I’m open to the needs of the future.

Create area

There is the dataset of the buildings available on the wiki page. I like that idea of huge GeoJSON file that includes the features with the corresponding geometries. As I’m not the import guy, I’m confused with _key_s in the properties (I mean these underscores of each key.) I need only building:yes tag, so I’ve renamed just those (note that notepad’s “Replace All” would do the same:)

sed -i 's/_building_/building/' buildings.geojson

I’ll create new area to work on. Therefore, I need the geometry of the whole area, where the buildings are. For that, I’ll use the damn-client.py scripts. (The shapely must be installed.)

cd damn-client.py
./convex_hull.py buildings.geojson > ch-buildings.geojson

The command took about a minute on my laptop. The ch-buildings.geojson can be used as the GeoJSON boundary file in the damn project’s manager.

Buildings of the squares

So I’ve area to work on divided to squares. Now, I need the GeoJSON files containing all the buildings of each square. I’ll use the damn-client.py scripts once again:

cd damn-client.py
./prepare_tmp.py https://server.damn-project.org 2351 buildings.geojson

See full entry

StreetComplete was designed by Tobias Zwick and launched in 2016 as a handy “low-bar entry” field capturing application for OpenStreetMap. In the following 2-3 years it rapidly rose to have a share of 3.9% of contributors favoured application, since it requires no real prior expertise in OpenStreetMap. The beauty of it is that it exploits the opportunity of a mapper being in situ where some features have been mapped, but lack details about their attributes, and tags on the OpenStreetMap database.

The UX is good, even for the experienced mapper it masterfully detects the absence {not to jump down a rabbit hole, but very like my favourite Pink Floyd Album } of tagging details, and then it supports the insertion of the correct tags with menu systems that are visual rather than everything being list driven. Perfect for being on the move, a car passenger or a leisurely walker. This is not supposed to be a review of the app, but you can probably detect that I am a fan.

With some help from my friend Amanda who downloaded the .pbf, and extracted all the editor traces of StreetComplete here I was able to get hold of a csv of all of the Ireland edits and then use that to make a heatmap, with some help from RustyB. The heatmap shows, what we would expect, greater use of the app in Ireland’s cities and large towns.

See full entry

Posted by yvecai on 28 June 2021 in English. Last updated on 29 June 2021.

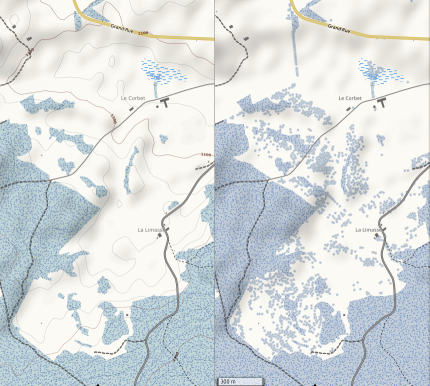
Working on an upgrade of OpenSnowMap.org map style, I knew I had to add single trees mapped natural=tree, natural=tree_row and barrier=hedge. I figured out I had omitted them in my rendering when I was about to map some … that were already there.

When testing the new style, it comes out as a nice surprise that in some areas, countryside micro-mapping is really impressive : Without / with single trees

Clearly, rendering all those trees gives a far better idea how the landscape look like there.

I expect that this new style will come live within a few weeks.

Location: 46.805, 6.443
Posted by Tikbalang on 28 June 2021 in English. Last updated on 29 June 2021.

Paglat a place that is rich in biodiversity and culture. If you will try to search Paglat in google maps, you will be mislead by wrong information about the place location. You will find it’s location inside another Municipality. Apparently Apple Maps was accurate about Paglat’s map and geotag location. Yes interesting indeed about google maps location of Paglat.

Established and created in 2001, under the Muslim Mindanao Authority Act No. 12 otherwise known as the Regional Law creating the Municipality of Paglat on July 9, 2001, which was ratified by its constituents during the September 29, 2001 plebiscite.

The mother municipality of Paglat was General Salipada K. Pendatun (GSKP) or to simplify it Paglat was a Barangay curved from GSKP.

Paglat’s boundaries or adjacent Municipalities are President Quirino province of Sultan Kudarat, Pandag province of Maguinanao, Tulunan province of North Cotabato, General Salipada K. Pendatun province of Maguindanao.

Location: Paglat Municipal Complex, Paglat, Maguindanao del Sur, Bangsamoro, 9632, Philippines
Posted by escallic on 28 June 2021 in English. Last updated on 29 June 2021.

The amount of segments used to represent a curved feature is based on assumptions. For example, an editor may interpret a mapper’s input by merging points that are too close together. Many aspects of the editing process depend on the drawing of curves, and many parameters are assumed by an editor.

A drag is a gesture well suited to mapping curves. Instead of lifting from a trackpad - an event which can throw the mapper’s precision off - the mapper drags along the feature’s centerline. Such a mode provides more consistent levels of mapping detail, a speedup in which a mapper can trace features, and a more natural feel to mapping. However, it requires more assumptions by the editor used.

In order to draw a line, one may drag from a way. The same gesture may move the map using merely a capacitive touch. I wonder what the current state of dragging is in all of the editors. Does a feature lack curves because it is closer to an urban grid or because it is tedious and/or arbitrary to map.

See full entry

Posted by dónal on 27 June 2021 in English.

Changset ID # 107053042

Cork County Council in conjunction with TII (Ireland’s authority for major roads) are in the process of building a bypass past Macroom and Ballyvourney in Co. Cork, Ireland.

Recently, I was travelling back from Killarney and noted that the road had been re-aligned. I quickly captured some GPD traces and have now updated OpenStreetMap with the new roundabout and re-aligned N22 (the bypass will assume the N22 name I presume when it opens).

This was a relatively nice edit to undertake. While I only had one trace to work with, it was good enough to get a rough idea of what needed to change. I also had to amend the N22 route relation(s) - there were two; one in each direction. I didn’t have a whole lot of experience editing these types of relations but the josm interface was intuitive.

As always, I wanted to validate my work (especially as I was editing a primary national route in Ireland). ra.osmsurround.org is a great tool for that so I checked both relations for issues (see relations 3147725 and 558006).

I expect more changes in the coming months as work progresses on this road.

Finally, I checked to see if other map providers had picked up on the change. Funnily enough it appears that Google have picked up on it (possibly using data from Google Maps’ users) but in much lower detail. I guess their algorithms detect something is up but don’t know how to deal with it properly yet. 1-0 to OpenStreetMap!

p.s. Driving round the roundabout 3-4 times was quite fun and a great way to get a good trace for it.

Images

See full entry

Location: Carrigaphooca, Kilnamartery, Municipal District of Macroom, County Cork, Munster, Ireland
Posted by Robhubi (inaktiv) on 27 June 2021 in German (Deutsch). Last updated on 19 December 2021.

Lange Zeit war mir Mapillary eine wertvolle Unterstützung beim Taggen. Seit einigen Monaten nicht mehr. Mapillary entwickelt sich offenbar in eine Richtung, die meinem - zugegebenermaßen speziellen - Workflow keinen Raum mehr gibt.

Wenn ich draußen unterwegs bin, ist mein Garmin Oregon 650 immer dabei. Videos erstelle ich keine, besondere Situationen halte ich mit Fotos fest. Im Regelfall sind meine Sequenzen kurz: ein Überblicksfoto zur räumlichen Orientierung und einige wenige Detailfotos. Häufige Motive sind Wegweiser, E-Ladestationen, Gebäudedetails u.a.m.

Vor jedem Hochladen prüfe ich die Fotos auf (i) Blickrichtung (ii) die absolute Lage und (iii) die relative Lage zueinander und korrigiere sie gegebenenfalls. Die meisten Fotos benötige ich gar nicht auf Mapillary. Zum Taggen kann ich die Fotos genau so gut in JOSM direkt laden und verwenden.

Nur in Fällen, wo mir das vollständige Taggen zu schwierig oder zu aufwendig ist, füge ich dem Objekt gerne einen Mapillary Link zum Foto hinzu. Das ist der einzige Grund für mich Mapillary zu verwenden und das wurde immer schwieriger. Die Chronologie:

  • ab Juli 2020 ist die Blickwinkelkorrektur mit dem Browser sehr umständlich geworden
  • zeitgleich begann auch das Zerhacken von zusammengehörigen Bildsequenzen bei Aufnahmen mit Fußgängergeschwindigkeit.
  • ab Februar 2021 verschwinden vermehrt hochgeladene Sequenzen. Diese tauchen gar nicht oder erst nach Wochen und Monate wieder auf.
  • ab Mai 2021 dauert es oft mehrere Tage bis die hochgeladenen Bilder auf der Karte erscheinen. Wenn überhaupt.
  • im Juni 2021 wird der Web-Uploader eliminiert. Der Ersatz - der Desktop Uploader - wird unter Win 10 vom Defender geblockt.

See full entry

Posted by amapanda ᚛ᚐᚋᚐᚅᚇᚐ᚜ 🏳️‍⚧️ on 27 June 2021 in English. Last updated on 28 June 2021.

Just for the record (because I’m telling everyone), I’m transgender! 🙂 I’m transitioning to live openly and honestly as myself, as a woman now. 🙂 (To my LGBTQ+🏳️‍🌈 friends, I’m simplifying for the cis 😉) My name is Amanda McCann, and for pronouns they/them is fine, but she/her is nice. Auf deutsch, meine Pronomen sind „sie“.

My old email addresses will still work, but amanda@technomancy.org is my personal email address, and amanda.mccann@osmfoundation.org for OSMF Board matters.

On github, I’m amandasaurus on github, Amᵃᵖanda on the OpenStreetMap Wiki, and @Amanda#2524 on Discord, am{ap}anda on IRC

Like always, I am open to good faith questions from OSMers on LGBTQ issues. If there’s a question you’ve always been afraid to ask, you can ask below as a comment, or email me. 🙂

Don’t forget one of the rules of OSM: Have Fun! 🏳️‍⚧️

Are you part of a local chapter, or a local community, putting together an organized project, or developing software? We’d love to hear from you at the OSMF Board meetings. Please get in touch with us or comment on this post.

Over a year ago, the OSMF Board began inviting Local Chapters to present at our monthly Board meetings. It has been consistently great to hear about OSM activities around the world directly from the people involved. Very useful for the Board and those keenly interested in Foundation governance to get as full a picture as possible. Thank you to OpenStreetMap Italia, OpenStreetMap á Íslandi, OpenStreetMap France, FOSSGIS, FLOSSK, OSM Ireland, and OSM UK!

We realized there’s more voices we could hear from, and over the past two months, have opened the door to any OSM community and other projects like software development.

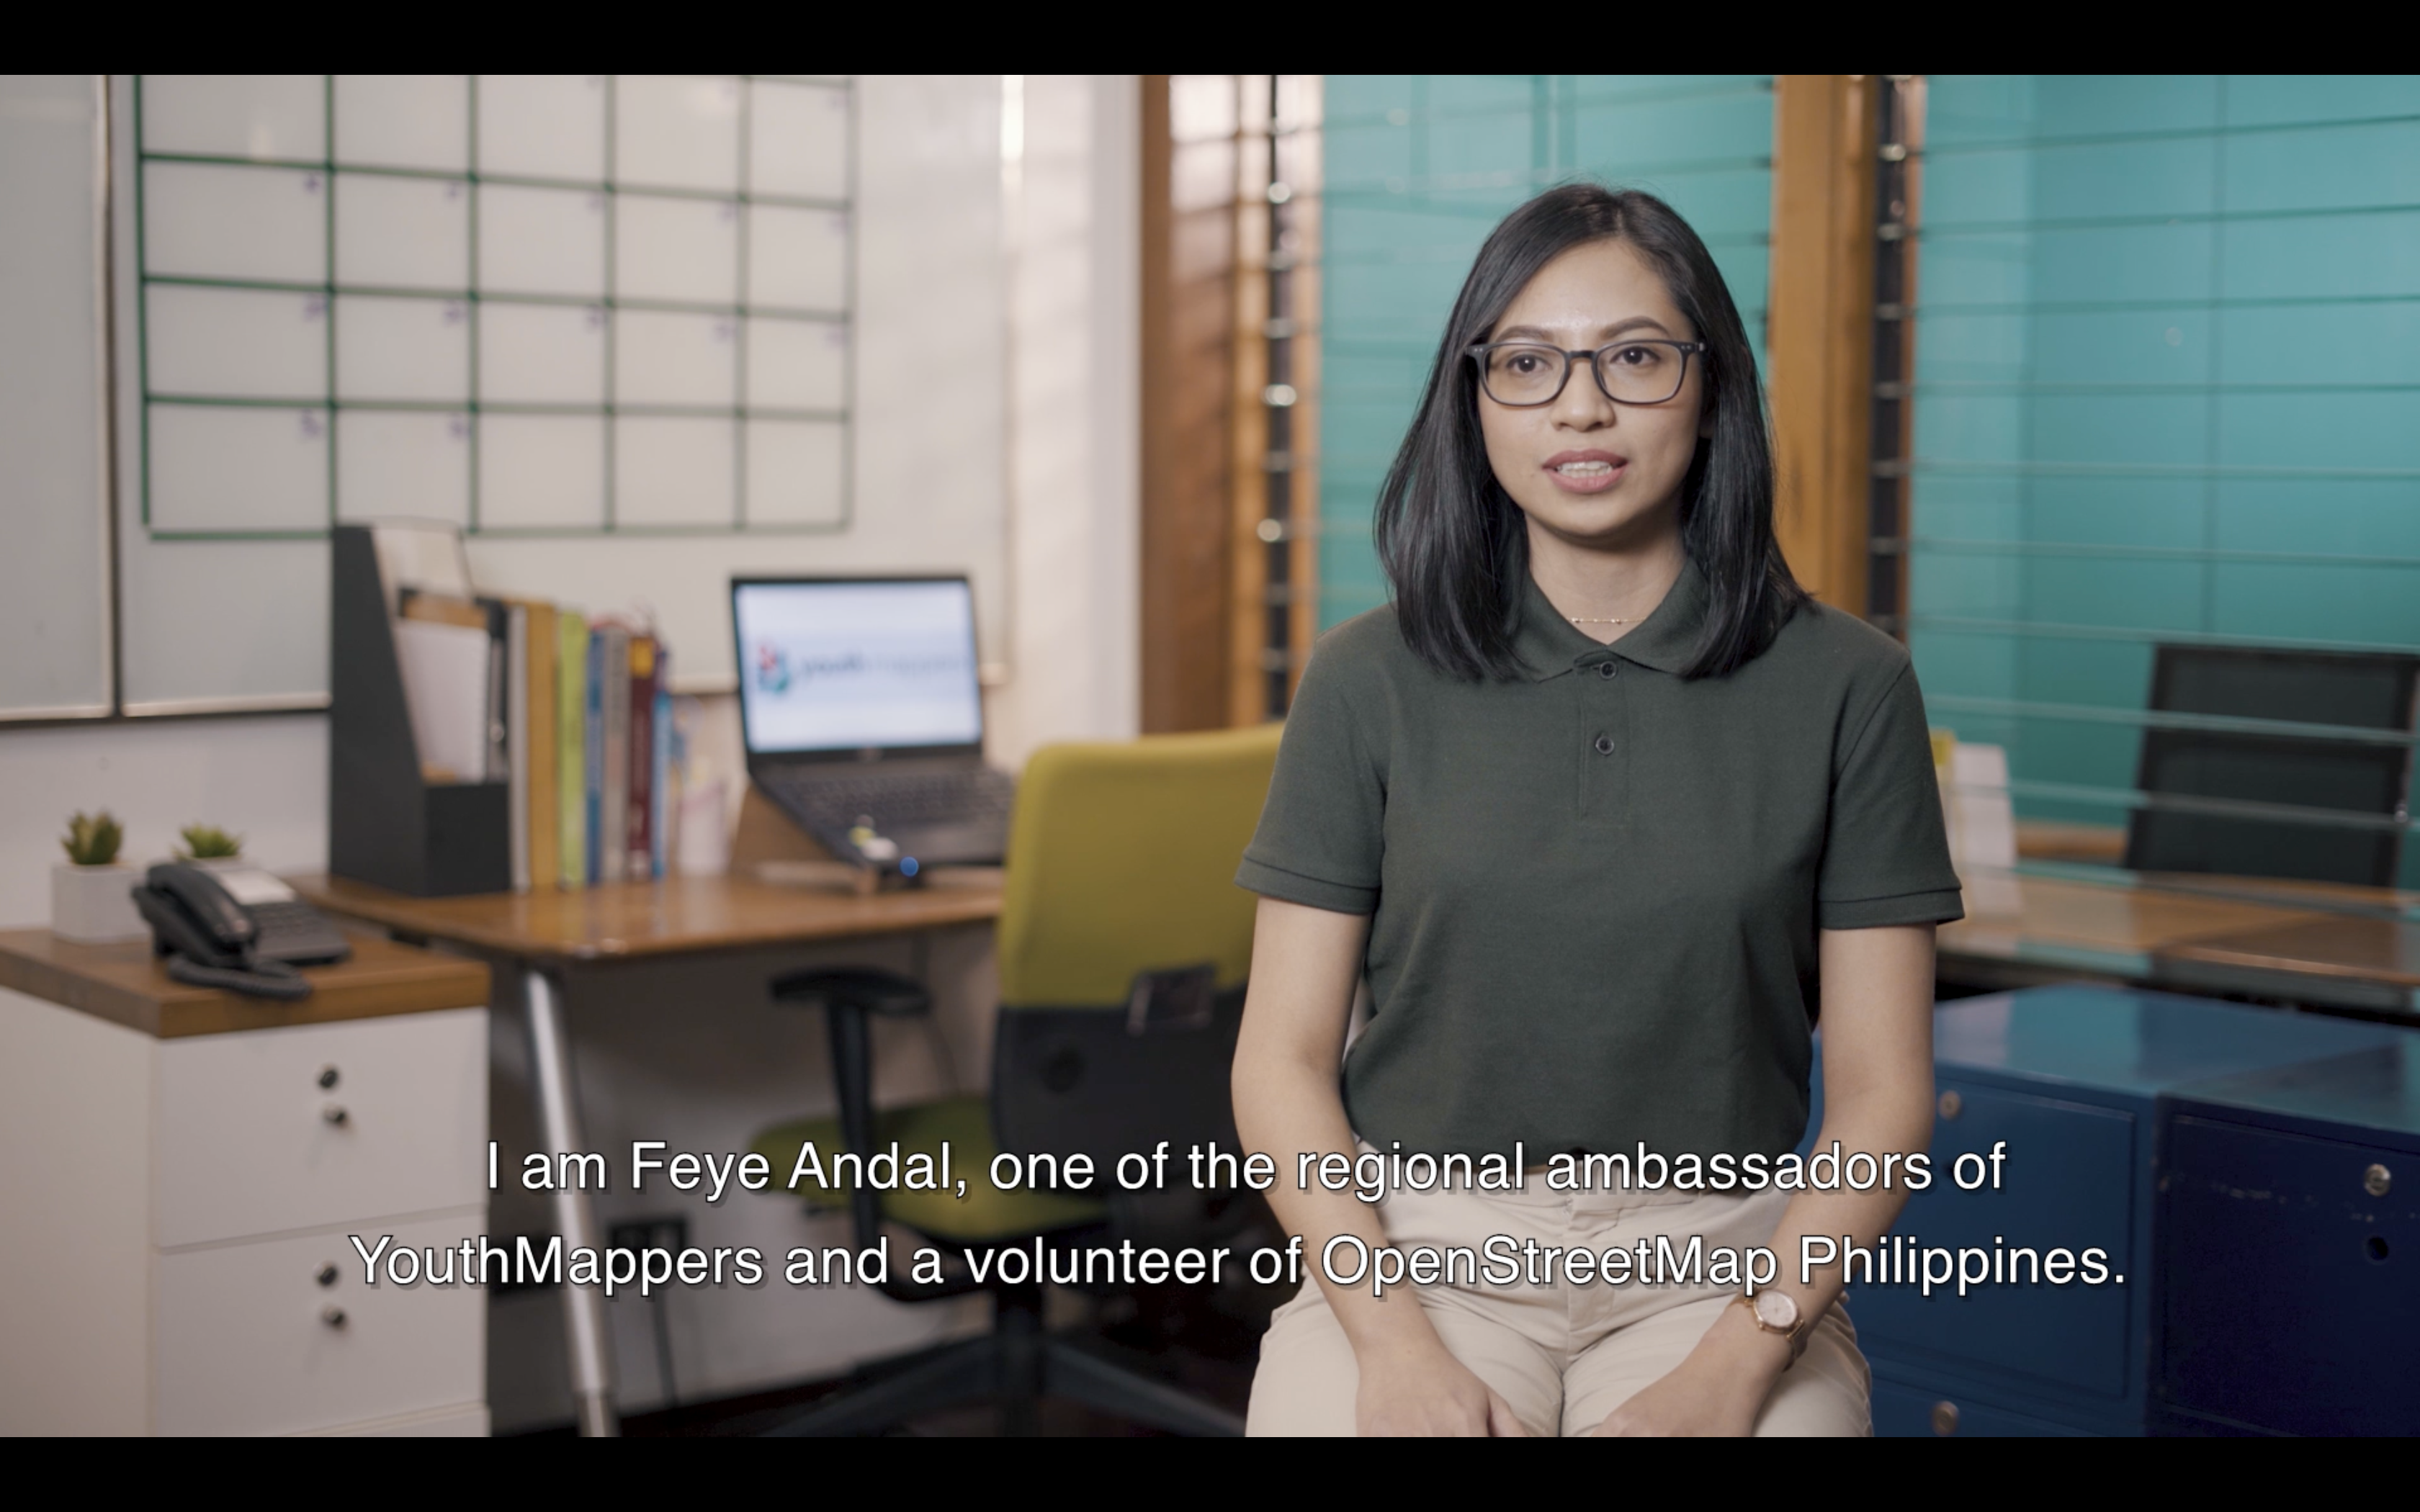
In May, Jochen Topf shared his experiences developing key pieces of the OSM software ecosystem. And this month, Feye Andal shared work across the incredible OSM-PH community. Next month, we have Sarah Hoffman coming to talk about nominatim!

There is so much happening across our amazing community. For the Board and others involved in core governance in OSMF, we want to have this front and center to our efforts. We appreciate the time everyone has spent to share their work with us, and encourage everyone else to signal your interest!

I hope you and your family are safe, healthy, and happy in this challenging time. I have been meaning to write this post since I became the Regional Director for the Asia Pacific Hub early this year. However, I decided to wait until I had something specific and useful to share with you all. Recently, we have made a few important decisions that I am thrilled to share with you through this post.

First, we have decided to name the Regional Hub as ‘Open Mapping Hub- Asia Pacific’.The ‘Open Mapping Hub’ name will also apply to the hubs in three other regions. I believe that this decision is profound and far-reaching. Although HOT is supporting the establishment and operation of the hub, we did not want to narrowly name it something as ‘HOT Asia Pacific Hub’. We want to ensure that the hub creates an accommodating and equitable space for everyone interested in contributing to the OSM movement in the region. We want the hub to be as inclusive as possible.

Those who attended Tyler’s talk at the Humanitarian OpenStreetMap Summit in December 2020 should not be surprised by this decision. In his talk, Tyler committed to shifting HOT’s focus from HOT to the wider OSM local communities. The name ‘Open Mapping Hub’ intends to encapsulate this very spirit. We are extremely excited to start our journey with this new name, and I would like to thank everyone who participated in the naming discussion.

See full entry

Posted by feyeandal on 27 June 2021 in English. Last updated on 28 June 2021.

Last September 2020, the OSM-Philippines community released the Call to Correct Narratives about Geospatial Work [in the Philippines]. We’re provided with an opportunity to share our own narratives and showcase the local community’s initiatives through a documentary-video produced by Amazon Web Services – Philippines.

snapshot

See full entry

How-To Add the WMS dataset “Verkeersborden Vlaanderen” to JOSM as a layer

After adding the layer, I was able to get the location and a visual representation of the “verkeersborden” (traffic signs) as registered in the “Verkeersborden Vlaanderen” dataset, as a layer on my OSM map.

Dataset “Verkeersborden Vlaanderen”

Read information on Verkeersborden Vlaanderen about usage, rights etc.

Adding a WMS dataset as a layer in JOSM

  1. Navigate to https://verkeersborden.vlaanderen/opendata.php
  2. Capture the links to the WMS datasets:

In JOSM

  1. Open in the menu “Edit” > “Preference”;
  2. Select in the left pane “WMS TMS”,
  3. Click on the button “Add a new WMS entry by entering the URL”; the “Add Image URL” dialog box opens.
  4. Enter under (2) “Enter GetCapabilities URL” the URL, e.g. “https://opendata.apps.mow.vlaanderen.be/opendata-geowebcache/service/wms?REQUEST=getcapabilities”
  5. Select the layers
  6. Enter under (7) a name for the layer, e.g. “Verkeersborden Vlaanderen”
  7. Click on OK