I see there’s an “OpenStreetMap US” but not “OpenStreetMap Illinois”?
Users' Diaries
Recent diary entries
Posted by JuanElDemografo on 16 September 2025 in English.

I’ve been editing OSM for about nine months and have been a heavy JOSM armchair editor for about eight months. Recently, I started using a stylus for entering geometry and it’s increased my stamina tremendously. I’ve been able to create hundreds even thousands of nodes per day without feeling any signs of repetitive strain injuries cropping up in my hand.
Posted by dcapillae on 16 September 2025 in Spanish (Español).
Last updated on 21 September 2025.

Los stolpersteine son adoquines conmemorativos que rinden homenaje a las víctimas de los campos de concentración nazis. Esta mañana pasé por el pueblo de Almogía para fotografiar tres stolpersteine que se inauguraron el pasado sábado, 13 de septiembre, en memoria de tres vecinos del municipio que fueron deportados durante la segunda guerra mundial.
 Adoquines conmemorativos en Almogía (ubicación). Fuente: trabajo propio (CC BY-SA 4.0) disponible en Wikimedia Commons.
Los homenajeados son Pedro Leiva Pino, Pedro Díaz González y Rafael Martín Morales. Sus historias se recogen en un panel informativo que el Ayuntamiento de Almogía, en colaboración con la Asociación de Memoria Histórica del municipio, ha instalado junto a los adoquines, en la plaza de la Constitución.
Posted by Arun Kumar Saini on 16 September 2025 in English.
Someone ask me for “What experience do you have building websites with Open Street Maps using controls limit then monitor and report on tile usage?”
I’m currently exploring OpenStreetMap (OSM) and trying to understand what kind of real-world projects or applications can be built using it.
I’ve checked the documentation, but I’m still not sure how OSM data is typically used in actual applications or what kind of problems it can solve.
Could anyone please share:
Some common or professional use cases of OpenStreetMap
Any example project ideas or scenarios (personal, commercial, or open-source) where OSM is used effectively
Also, if possible, please suggest any recommended tools or libraries (like Leaflet, MapLibre, Nominatim, Overpass API, etc.) that are commonly used to work with OSM data.
Goal: I just want to get a clear idea of where OSM can be applied so I can plan my first project with it.
Thank you!
Posted by Arun Kumar Saini on 16 September 2025 in Hindi (हिन्दी).
मैं इस समय OpenStreetMap (OSM) को सीख रहा हूँ और जानना चाहता हूँ कि इसके इस्तेमाल से किस तरह के रियल-वर्ल्ड प्रोजेक्ट या एप्लिकेशन बनाए जा सकते हैं।
मैंने इसकी डाक्यूमेंटेशन देखी है, लेकिन अब भी मुझे स्पष्ट नहीं है कि OSM डेटा का वास्तविक एप्लिकेशन में कैसे उपयोग किया जाता है और यह किन समस्याओं को हल कर सकता है।
कृपया कोई बता सकता है:
OpenStreetMap के कुछ सामान्य या प्रोफेशनल उपयोग केस
कुछ प्रोजेक्ट आइडिया या उदाहरण (पर्सनल, कमर्शियल या ओपन-सोर्स) जहाँ OSM का इस्तेमाल हुआ हो
और अगर संभव हो तो, Leaflet, MapLibre, Nominatim, Overpass API जैसी कोई जरूरी लाइब्रेरी या टूल्स जो OSM डेटा के साथ काम करने में मदद करते हैं
उद्देश्य: मुझे बस यह समझना है कि OSM का उपयोग किन-किन जगहों पर किया जा सकता है, ताकि मैं इसके साथ अपना पहला प्रोजेक्ट प्लान कर सकूं।
धन्यवाद!
I have been preparing a RFC for several days, but now weekend is over and i won’t have time to finish things up. Here’s drafted tldr of a draft of a RFC in case this ends up as another forgotten project. Scope of this proposal is limited to Estonia. For international uses, I suggest to read EU report on waste sorting standardisation.
Problem: When surveying packaging recycling containers (PRC) it’s repetitive to list all kinds of waste collected there. There’s also risk of errors introduced by human input. My initial estimate is that trio of standard PRCs should get about 20-30 recycling:* tags.
Observation: PRC colours are standardised across Estonia – Paper blue, glass green and metal/plastic/beverage yellow (source). While Estonia has adapted Danish color schema as nationwide standard for garbage collection, PRCs have bit different colours. Standard-PRCs are often accompanied by reusable clothes container (no standard colouring).
Objective: Simplify & standardise mapping of different waste collected.
- Mapper has to simply pick colour(s) of the container(s) they see and..
- …preset ensures consistency of different waste types listed.
- Therefore PRC can be mapped at higher quality from further distance (assuming mapper doesn’t know PRC colour codes by hearth.
Solution: Introduce localised custom (iD & JOSM) editor tagging preset (e.g “Pakendikonteiner EE”)
Downsides:
- Difficult to scale legal rules up to international level, in some countries even to county level. Some cities may use own colours.
- Unclear if this idea is technically fully achievable (editor limitations, namely adding multiple colours to single node)
- Technical scale-up difficulties – possible performance loss is each major city or county in developed world gets own preset.
Initial idea originally published on 2025-09-12. Full 40 pages of notes are not processed yet.
Posted by Awo on 15 September 2025 in Spanish (Español).
Last updated on 8 October 2025.
El mapeo de Árboles en SotMLatam 2025.
Al caminar por las calles de San Javier y La Floresta (Medellín), lugar donde se desarrolló el evento más importante de OpenStreetMap (OSM) para Sudamericana, es evidente sentir y visualizar la presencia de sus grandes y diversos árboles. Ciudad preocupada y cuidadosa de sus individuos arbóreos, se nota la buena gestión y aplicación de la arboricultura y silvicultura urbana. Por tanto, es trascendente que sea acá en Medellín, donde el tag:natural=tree tome un protagonismo, que esperemos sea una constante para los próximos SotMLatam.
Sin dudas se puede afirmar que este 7° evento ha sido el iniciador de las ponencias donde se destaca la etiqueta natural=tree, el árbol. Este elemento de tipo nodo tiene un crecimiento exponencial, llegando ya a contabilizar en la base de OpenStreetMap los 30.160.988 con un porcentaje de participación del 11.11 %, a nivel mundial (Datos TagInfo al 05 de sep. 2025). Además, el nodo está relacionado en 46 proyectos. A nivel sudamericano los países con mayor registro de árboles, en orden descendente son: Brasil, Argentina, Chile y Colombia.
Los árboles se toman el mapa.
Debido a que fueron cinco las presentaciones, según el programa se agruparon en el tema: Arbolado y Bosques.
Destacaron por su mayoría los trabajos realizados en Colombia, por estudiantes universitarios de diferentes instituciones y carreras de pregrado.
Ditinition
Ditinition
Posted by mitseou on 15 September 2025 in French (Français).
Last updated on 5 March 2026.

Attention, plutôt utiliser highway=path que highway=cycleway : osm.wiki/FR:Bicycle#Voie_verte => Type d’élément = “Chemin piéton et cyclable” plutôt que “Voie cyclable”
Ce qu’il y a à Saint-Sernin : osm.org/edit#map=17/44.571782/4.389139
- Type d’élément : Voie cyclable
- Nom : Via Ardèche
- Sens unique : Non
- Revêtement : Asphalte
- Régularité du sol : A roue fine
- Largeur : 3 mètres
- Accès autorisés : Tous : no / A pied : designated / Vélo : designated
Ce qui niveau attributs donne :
- access : no
- bicycle : designated
- foot : designated
- highway : cycleway osm.wiki/FR:Tag:highway=cycleway
- horse : no
- motor_vehicle : no
- name : Via Ardèche
- oneway : no
- railway : razed osm.wiki/Tag:railway=razed et https://forum.openstreetmap.fr/t/disused-railway-rail/18435/5
- smoothness : good
- source : Bing ?
- surface : asphalt
- width : 3
(URL)
Posted by ChicoXXX on 15 September 2025 in Spanish (Español).

ID Editor fue como muchos empezamos a editar en OpenStreetMap; después al subir el nivel empezamos a usar JOSM, con las ventajas que vienen con él.
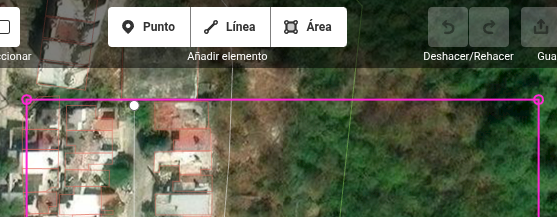
Pero una cosa que extrañaba de ID Editor era que mi área de trabajo en JOSM estuviera delimitada con ese cuadro de color magenta. Estuve buscando en mis ratos libres hasta que encontré como cambiarlo.
Started with Thurso on the North Highland Way. Our preferred hotel supplier is there
Posted by Raquel Dezidério Souto on 14 September 2025 in Portuguese (Português).
– only in Portuguese
Editora IVIDES abriu período de inscrições de propostas de capítulos para o segundo volume do livro
O prazo de submissão de proposta de capítulo para o livro “Estudos de caso em mapeamentos colaborativo e participativo”, volume 2, a ser lançado em 2026, foi estendido para aumentar o alcance da participação.
O livro possui uma seção sobre mapeamento com OpenStreetMap.
Prazo: 22 SET 2025
Idioma: português (qualquer variante)
Inscrições: https://ee.kobotoolbox.org/x/hBOFWAAg
No formulário para envio da proposta, são solicitados um resumo (400 a 500 palavras) e o nome do(a) autor(a) principal.
Será oferecido um prazo de 3 meses para envio do original e da lista completa de autores.
Preencha com cuidado o formulário para que possamos retornar o contato, a fim de organizar a sua participação.
O primeiro volume da obra pode ser obtido em: https://ivides.org/livros

GO Sync seems to go a long way in comparing GTFS to OSM handily.
It’s still a very labor intensive process, even on a relatively sparse transit system like MetroLink.
RapiD editor has rather unique feature that it can flag pedestrian crossings where node and way are tagged differently. But how to know where are such crossings if you can’t load entire city or country into iD editor? Luckily there’s overpass syntax for that. Quite a few people found this query useful, therefore I’m sharing it with wider audience.
Most of query was produced by LLM after feeding it with Overpass QL language reference. Only parent.u syntax needed manual fixing. I decided to use dynamic comparison of tag values because I wasn’t sure what would happen if there were some unique tagging typo, such as crossing=marked2 or similar.
[out:json][timeout:180];
{{geocodeArea:Estonia}}->.a;

/* Ways that explicitly have crossing=* */
way(area.a)["crossing"]->.ways;

/* Loop each way as .parent */
foreach.ways->.parent
{
  /* crossing=* nodes of parent, but
     with different crossing value */
  node(w.parent)["crossing"]
    (if: t["crossing"] != parent.u(t["crossing"]))
    ->.badnodes;

  /* Output if there is at least one mismatching node */
  (.badnodes;)->._;
  if (count(nodes) > 0)
  {
    .badnodes out tags geom meta; /* the mismatching node(s) */
    .parent   out tags geom meta; /* the parent way */
  }
}
Originally published at OSM World Discord on 2025-08-23
First post in hopefully a series of entries where I’m planning to share various OSM-related experiments I have conducted over the years.
Mapper asked if area should be mapped as grassland, scrub or heath. Since this kind of information is better to be extracted from infrared imagery, without knowing where the mapper is from, I pointed them to use global satellite dataset provided by European Space Agency (OSM wiki link) at Copernicus browser.
Two most commonly user IR imageries are using CIR-NRG and CIR-NGR styles. These acronyms essentially mean that when compared to regular RGB (red, green, blue) pictures, infrared images drop blue signal channel and instead use IR as red, and then original red and green as green and blue. For NRG, red becomes green and green turns blue; NGR is vice versa with green staying green and reds are blue.
Turned out that while Copernicus does have multiple infrared imagery layers (such as one simply called False Color is NGR), but because infrared channel is relatively overexposed compared to visible light, then default configuration showed nothing but red (IR) patches on black earth. Solution was building a custom rendering with linear adjustments.
In hindsight, Copernicus browser has button called “Effects and advanced options applied” where one could apply most of those transformations directly without custom layers.
Anyways, custom layer is basically javascript code that should execute on client’s browser for every single pixel on image and calculate RGB values for each. Here’s the tutorial.
I haven’t figured out most feasible way to add pictures to diary posts yet.
- Go to https://browser.dataspace.copernicus.eu/
- Click on green diagonal arrow (↗️) on sidepanel to see latest images
- Select Layers -> Custom (at bottom of list) -> Custom script (rightmost tab)
- Paste script and click apply below textbox.
- Colour balance and lightness can be tweaked using sliders under button “Effects and advanced options applied”
Ko có gì ở đây 🤡

You can find a German version of this article here: Kreise in MapLibre
I want to integrate a Geolocate control into a MapLibre map and customize it both visually and functionally to fit my app.
At first, I considered using the GeolocateControl that comes standard with MapLibre. However, I quickly discarded this approach because adapting it to my needs seemed too cumbersome without a lot of fiddling.
My goal is that when the button is clicked, the display of the current location is toggled—so it can be turned on and off.
MapLibre itself offers several ways to draw circles on the map, depending on whether they should be pixel-accurate or meter-accurate.
Circles on a MapLibre Map
My starting point is a simple map.
