prince of university
Users' Diaries
Recent diary entries
Cette entrée a pour but de répondre à une question posée sur le forum, mais rédigée pour donner plus une vue d’ensemble de l’activité qu’une simple description des méthodes.
Appréciant particulièrement la micro-cartographie, les cheminements des piétons ont naturellement fait partie de mes préoccupation depuis presque les débuts de ma contribution. Mais la tâche était immense (surtout pour une agglomération de la taille de celle où je résidais alors) et je ne passe pas tant de temps que ça dehors avec un ordiphone à la main…
Groupe local et évolutions techniques
Mais depuis, plusieurs choses ont évolué.
J’ai découvert StreetComplete, qui contient plusieurs quêtes sur les trottoirs et passages piétons (en particulier l’accessibilité de la bordure entre l’un et l’autre). Plusieurs utilisateurs au sein du groupe local angevin utilisent StreetComplete — notamment Sébastien Chopin, qui sillonne littéralement l’agglomération.
En particulier, ces utilisateurs qualifiaient le filaire là où il existait déjà et ne pas avoir cette possibilité partout en fonction des filaires créés ou non était dommage.
D’autre part, la qualité des orthophotographies disponibles s’est nettement améliorée, les trottoirs et passages piétons étant généralement parfaitement visibles.
Et enfin, le groupe angevin est plutôt intéressé dans l’ensemble aux questions d’accessibilité. Sébastien Chopin — toujours lui — entreprend même des démarches d’acquisition de matériel spécifique.
Débroussailler
Dans ce contexte, la cartographie à grande échelle des cheminements piétons est redevenue un de mes sujets d’intérêt.
J’ai donc commencé à planifier une modification d’envergure sur la commune d’Angers pour ajouter autant de filaires de trottoirs et de passages piétons que possible à partir des imageries disponibles.
Whenever I use files containing OSM data, I’m faced with two major
problems. These problems are inherent in the OSM data model and
inherited by the common file formats (.osm, .o5m, .pbf).
The first of these problems is about accessing the data: As a result of the data model users are forced to use either huge amounts of memory or a lot of time. Often even both.
The second problem is even worse: Quite often you have to guess properties of the data, which means using heuristics. But by their very nature, they can lead to wrong results. The most prominent example is probably the question, if a closed way element represents a linear object or an area.
To overcome these problems I invented a new file format. The main idea: Convert the data once (accepting the drawbacks caused by the two problems) and end up with data that can be processed fast, using only little memory. I also tried to keep the file size small and the file format simple.
I called the new format “OMA format” like “Open MAp”. It’s accompanied by a human readable version called “OPA format” like “Open PAper”. (Oma and Opa are the German words for grandma and grandpa).
It took me about a year to design the Oma file format, and write a converter and a library for querying the new file format. I still consider it in experimental state, as I would like to get some feedback before releasing a stable version. Hence this post.
All this is a lot of stuff and I can’t go into all the details in just one blog post. For this reason I’ve decided to keep this article brief and base it on a single example. In the coming weeks, I will be writing more articles about the new file format, which will provide more in-depth information.
Scattered Data in OSM Files: The Viktorstraße in Wuppertal
My personal enemy that I take so serious, is someone who edits an area on a map as “under construction” and then it SITS for longer than 6 months in that stage. In some cases people have been living in that neighborhood for 3 years…and it’s been marked as “under construction.” Here I am today fixing areas that are fully developed now, fully established- and the average of the construction edits were made 2 years ago. Here’s hoping doordash, my personal use favorite Strava, or even pokemon go run an update for those poor folks.
This is purely a diary rant about residential areas and their roads not being updated. I almost wish there was a way to make “under construction” just be something for an existing thing being updated/fixed, not something being built. We’re mapping what’s there to be mapped. I’d rather new developments or roads have like a “coming soon” tag of some sorts that wouldn’t block in app access.
We can use strava as an example, i’ll set a route and it’ll make me avoid an entire neighborhood because “Deleted User” 3 years ago marked these 7 streets near the lake trail as “under construction.” Took me a sad amount of time, admittedly, to realize what was happening. Another example is Niantic not having in game spawns (pikmin, pokemon, ingress) if an area is marked “under construction” because the game labels the area as dangerous, so why would they give server room to RNG spawn their in game items there? Reality though is Ash can and SHOULD be able to catch his Pikachu there because he’s been living there for 3 years- Niantic just doesn’t think it’s safe.
So, here’s my little rant about the amount if neighborhoods i fixed today that i have personally been to, biked through, walked my dog through, that have been “under construction” the last 28 months.
I finally got back to mapping, after about 6 months of being inactive. I’m really happy!
Posted by se_bras on 6 March 2025 in Spanish (Español).
Hoy desarrollamos nuestro evento Open Data Day 2025: Escuelas en el mapa, un camino a la resiliencia en la Institución Educativa Ciudadela de La Paz, en Pasto, Nariño. Por segundo año consecutivo, desde el capítulo YouthMappers SAGEMA, apoyamos el diseño metodológico de la participación de la comunidad OSM Colombia en el Open Data Day, esta vez con un enfoque en el uso de datos abiertos en entornos educativos.

Junto a los estudiantes de grado 9, recorrimos la institución utilizando Mapillary, demostrando su importancia como herramienta para capturar imágenes inmersivas y mejorar la visibilidad de la infraestructura escolar. También empleamos Field Papers para mapear la distribución de espacios clave como baños, laboratorios, oficinas, salones, caminos, el restaurante escolar y la tienda.
Posted by Raquel Dezidério Souto on 6 March 2025 in Brazilian Portuguese (Português do Brasil).
Last updated on 27 March 2025.
– Read in English
Mapeamento de árvores no OpenStreetMap e palestras especiais
O evento será realizado em 31 de março de 2025, com atividades presenciais e remotas, pensadas para despertar para a importância dos dados abertos na dimensão ecológica, para fins de colaboração para a conservação ambiental e a melhoria da qualidade de vida dos habitantes, frente às consequências evidentes da crise climática, que têm piorado as condições ambientais nas cidades e levado ao aumento da pressão por recursos, especialmente, os energéticos.
🌳🌳🌳🌳🌳
| Serão concedidos dois certificados independentes (manhã/noite) | Inscreva-se até 30 de março de 2025, 23h59 (UTC-3). Vagas limitadas (20) para a atividade presencial (manhã). Para a atividade da noite, sem limite de vagas. LINK DE INSCRIÇÃO – Página do evento |
🌳🌳🌳🌳🌳

Since the end of 2019, the OpenArdenneMap map style has been updated on ~~a six-monthly cycle~~ from time to time. OpenArdenneMap is an open-source cartographic style for topographic maps based on OpenStreetMap data. The ‘winter 2024-25’ release has just been published.
That’s mainly small improvements in the QGIS-style that have been made. OpenArdenneMap is available for Mapnik (a software used mainly to create map tile servers) and QGIS (a more general GIS software).
In particular, there has been the addition of the ‘marked trails’ layer, which was still missing in the QGIS style. To add the marker to the map (the equivalent of the shield in Mapnik), we use a combination of 2 ‘Marker Lines’, with the superimposition of an SVG marker for the marker and a character (Font Marker) for the number often inscribed in the marker.
I have also added a map layout to the QGIS project file, which allowed to update an existing map on hiking.osm.be, for the map of Herbeumont.

Posted by Raquel Dezidério Souto on 6 March 2025 in English.
Last updated on 27 March 2025.
– Em Português
Fieldwork for mapping trees with OpenStreetMap and special lectures
The event will be held on March 31, 2025, in Portuguese, with fieldwork and remote activities designed to raise awareness of the importance of open data in the ecological dimension, in order to collaborate in environmental conservation and improve the quality of life of inhabitants, in the face of the obvious consequences of the climate crisis, which have worsened environmental conditions in cities and led to increased pressure on resources, especially energy.
🌳🌳🌳🌳🌳
| Two independent certificates will be awarded (morning/evening) | Register by March 30, 2025, 23:59 (UTC-3). Limited places (20) for the fieldwork activity (morning). Unlimited places for the evening activity. REGISTRATION LINK – Event page |
🌳🌳🌳🌳🌳
Goedendag, Sinds een tijdje verneem ik grote witte lijnen op de plattegrond. Kan iemand mij zeggen hoe dit komt en of het weer weg kan?
I’ve just rolled out some updates for waymarkedtrails, the website for browsing route relations. The most notable improvement is that waymarkedtrails is finally able to understand member roles in route relations. This post gives a quick overview of what works and what doesn’t and what has changed with in the route views.
Forward/backward roles
The first group of roles handled specially are forward and backward roles which indicate that the route follows the given way only in the direction of the way or in counterflow. These oneway sections are now shown when details of a route are displayed:
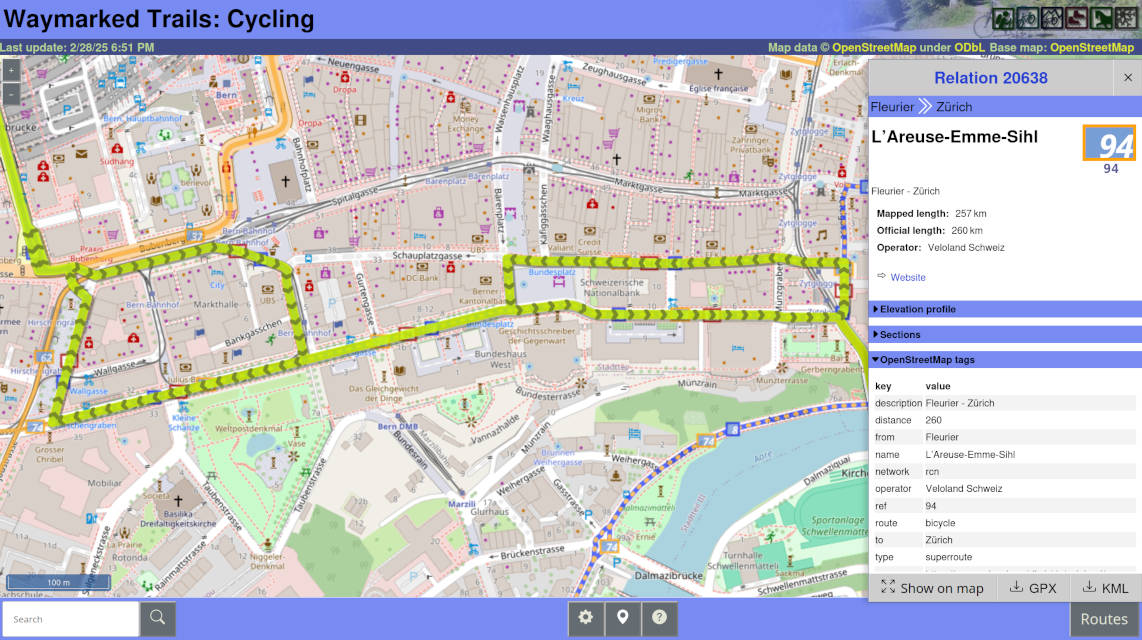
Waymarkedtrails will internally merge forward and backward sections into split sections and count them only once when computing the length of the route. However, this only works, when all ways of such a spilt section appear together in the relation and follow the order of the route. (See also the notes on ordering below.)
Roundabouts
Posted by Candid Dauth on 5 March 2025 in English.
OSM History Viewer and OSM Route Manager are two ancient tools that help visualising and analysing changesets and route relations. In particular, they provide the following features: * Show the geographic and tag changes that a specific changeset has caused * Render a route relation (with support for nested relations), detect gaps and inconsistencies, and export the route as GPX * Analyze the history of relation members and show who last edited (and is thus to blame for) which section of the relation.
I have not maintained these services in many years and they frequently crashed or got overloaded. The user experience was also far from great.
I have decided to rewrite the logic of these tools and integrate it into FacilMap. While the don’t particularly fit the use case of FacilMap, the infrastructure (in particularly the UI elements) is there, making it convenient to integrate it there.
So far I have implemented the first functionality, changeset analysis. You can analyze a changeset by typing changeset <id> (for example changeset 6798641) into the search field, or by calling the URL https://facilmap.org/#q=changeset%20<id> (for example https://facilmap.org/#q=changeset%206798641) directly. As opposed to the legacy OSM History Viewer, the analysis and API requests are now entirely performed on the client side.
I will implement the other two features soon. Once done, the old services will be shut down and a redirect will be put in place.
Feel free to report any problems that you come across by writing to me or by creating an issue.
Latest Update from Henderson.
All roads, sidewalks and parking lots were traced out. Traced out some of the park details as well. Unfortunately not too many commercial details or bing street side photos are available of this small town, so cant add too much more information such as stop signs, or storefronts.

For the next town, ill probably do something in the north north east.
Also, anyone have any updates as to when bing will work in JOSM again?

Harita güncelleme nasıl yapılmaktadır.
Posted by JanezPavelZebovec on 4 March 2025 in Slovenian (Slovenščina).

Dol pod Gojko
- 2024-12-20: hišne številke 1 - 4 (s soležečimi zgradbami)
- 2025-02-27: hišne številke 5 - 9 (s soležečimi zgradbami)
- 2025-03-03: hišne številke 10 - 17 a (s soležečimi zgradbami)
- 2025-03-04: hišne številke 17 b - 41 (s soležečimi zgradbami)
- dokončano

I want better local information so here I am learning and updating Open Street Maps! (4 MAR 2025)
Posted by Peter Elderson on 3 March 2025 in English.
Last updated on 2 April 2025.
Introduction
This diary entry describes my view on how best to map and tag pedestrian crossings and bicycle crossings. Best, considering detail, correctness, time consumption, clarity and usability. The many words in this diary may make it seem complicated, but the actual tagging is easy and direct node tagging of what you see on the road, with as little redundancy and required expertise as possible. As follows:
A simple unmarked, uncontrolled crossing, without special characteristics such as tactile paving, lowered kerbs or traffic island, is just an intersection node without any tags.
A simple zebra can be tagged with highway=crossing + crossing:markings=zebra. The usage of highway=crossing + crossing=zebra is seen as entry level duck tagging.
A simple crossing with other markings can be tagged with highway=crossing + crossing:markings=dots/dashes/lines/surface
If traffic lights control the crossing, add crossing:signals=yes
If there are special kerbs, add kerb=lowered/flush/…
If there is tactile paving, add tactile_paving=yes
If there is a crossing island within the crossing, add crossing:island=yes
If the crossing path goes uninterrupted over the road it crosses, so that the road is interrupted rather than the crossing path, add crossing:continous=yes
Scope:
- Footway crossing any higher order way, including cycleway and busway, excluding rail.
- Cycleway crossing any higher order way, including busway, excluding rail.
- Mentioned, but not detailed: paths, including combined footway/cycleway paths as mapped regulary in Germany.
- Mentioned, but excluded: designated horse crossings.
- Mentioned, but excluded for now: how to map a crossing as a way.
- Mentioned, but excluded for now: detailed mapping of the operation of traffic signals.
- Mentioned: level crossing over tram railways
Basic principles:
The latest updates from the town of Hernderson Nebraska. I believe i have around 90% of the buildings mapped. Once done, will move on to the sidewalks, parking lots, and other navigation details visible from the sky.

2025年2月22日,羅東街景踏查團在台灣維基媒體協會支援下,由 OpenStreetMap 台灣以及 Wikidata 台灣一同進行,收集街景影像以及廟宇的圖像記錄。這次特別邀請在林業管理單位工作的陳建忠,寫了兩篇 Facbook 貼文(1、2)談到他因工作關係常會獨自踏查,這次羅東廟宇工作坊則是能夠以團體方式進行,能夠彼此交流方法。而宗教專家提到宜蘭的靈場,他也列出宜蘭這一帶的分佈,發現隨著時代演進地貌已經改變,有些廟宇位置已經不在原先的位置了。
我這邊因為決定參與 g0v 大松,就沒過去羅東,遇到 ProtoMaps 開發者 Brandon Liu。我事先已經先鍵盤繪製羅東週邊了,還有當天依照臺灣宗教與民俗文化平台加台北艋舺,尤其偏大加魶一帶廟宇。Brandon 有協助 Meta 地圖團隊做事,前陣子把 Overture Maps 資料集套疊到 RapiD 編輯當中,但不知道誰用。看到我弄就趕緊拍一張照片。而我也真的編輯加了一間廟。

Currently Working On / Have Worked On:
Ayaş
- Most roads in the district center have been mapped.
- Almost all roads in the district center have been named.
- Most school information in the district center has been updated.
- Some building information in the district center has been updated.
- Some important POIs in the district center have been added or updated.
Beypazarı
- Some roads in the district center have been mapped.
- Almost all roads in the district center have been named.
- Some building information in the district center has been updated.
- Some important POIs in the district center have been added or updated.
Etimesgut
- Few roads in the district center have been mapped.
- Few roads in the district center have been named.
- Most road surfaces in the district center have been mapped.
- Most road lanes in the district center have been mapped.
- Most road lighting conditions in the district center have been mapped.
- Few school information in the district center has been updated.
- Most building information in the district center has been updated.
- Most important POIs in the district center have been added or updated.
- Some garbage bins in the district center have been added or updated.
- Some bus stops in the district center have been added or updated.