 OpenStreetMap

Well, I finally got around to trying to undelete the bit of trail in Redwood National Park between Tall Trees and Emerald Ridge, which didn’t take long because I’d already done the hard bit of finding which way that was by finding the deletion changeset. Unfortunately, there’s a lot of things in this area that nag at me. For instance, while I was (not) discovering if there was any reason the trail was deleted, I sorted out the nag about getting the seasonal bridges correctly tags for that attribute. Maybe. It could be “seasonal=summer/autumn” (used on the bridges) or “seasonal=dry_season” used on the trail. Does dry season start when the rains end or when the creek starts to get low too? Because that creek stays high into the dry, making summer/autumn possibly more accurate. Dry/wet season also can require some lookup. If I saw something was “wet_season” in the southwest US deserts, a few years ago I’d expect that means winter, but now I know it might actually mean July and August, when the monsoonal moisture comes through, but when the southwest US coast I grew up on has average monthly rainfall of 0.04 inches.
Users' Diaries
Recent diary entries

Dear community,
anyone has an idea where to find shape files from Latam/Peru? Best wishes and hugs, Anne

During the COVID-19 outbreak, online conferences became more popular as that was the only way for conferences to happen, State of the Map Africa 2021 happened online as well, which made the conference more accessible to people than before, a record 597 participants joined through Hopin the conference platform which had features that allowed participants to actively engage and interact.
Post COVID-19, there is now interest in organizing hybrid events instead of going back to completely offline conferences, to take advantage of the benefits that come with an online event that makes a conference more accessible. During the State of the Map Tanzania 2023 conference we tried out the hybrid set up, with a view that it would also help us prepare for State of the Map Africa 2023, in Yaounde Cameroon, which is going to be a hybrid event. Below I share lessons learned that may be helpful for other conference organizers in setting up a hybrid event
To set up a hybrid conference, you need at least five basic things
- A conference platform for online and offline participants to engage and interact. The conference platform should have an option for embedding livestreams from YouTube or directly from a streaming software. The platform should also have chat, Q&A, polls, reply and comment features. Options for speed networking, booths for sponsors, etc. There are hundreds of conference platforms out there, below are some that have been used at State of the Map and related Conferences;

The idea
This entry will describe one application of our GNIS matching program using a very narrow slice of the dataset.
While looking through the Populated Place feature class, I noticed a rather substantial number of names for mobile home parks. I was immediately reminded of the MapSwipe effort in coordination with YouthMappers and the ASU Knowledge Exchange for Resilience.
The full GNIS file has ~7000 entries that look like they will very likely be the location and name of a mobile home park. Running the GNIS Matcher against the ones in Arizona gives 516 places to check the map for either tagging improvement or new geometry.
You can check out the project here.
How to map
There is an amazing guide produced by ASU that has a huge amount of detail about mapping mobile homes. Definitely look it over.
Tagging
An area drawn to represent a mobile home park should have tagging like:
landuse=residential
residential=trailer_park
name=Estrella Villa Mobile Home Park
There is occasionally some confusion between this and a similar tag tourism=caravan_site. This tagging may also show up in places with trailers/RVs but the intent is for that to mark temporary stopping locations, similar to tourism=camp_site.
The matcher would also like a GNIS ID included. The appropriate tagging looks like:
gnis:feature_id=2669824
Drawing areas
In general, try to draw a boundary that encompasses all of the residences. There are often clues in aerial imagery that help delineate the specific park from other areas (guide). Look for fences, pavement differences, and road connectedness to guide your judgement. If there is high ambiguity, it may be helpful to leave a Note for local mappers.
Street side imagery from Mapillary or Bing Streetview is often helpful and has the appropriate license for OSM use.
Examples
No area found, needs mapping

Hello community. While I was mapping, I noticed there are not many electrical charging stations yet on OSM. Since the world is fighting to lower the carbon emissions, and electrical vehicles are bought in high demand.
We should not forget to add public electric charging stations on the maps. It can help a lot to be the first all in one service that you not need to install another centralized app for finding your nearest charging station.
I am a developer at an energy research institute, and so the topic of electric vehicles and charging stations is one that comes up often in my discussions with colleagues. One colleague mentioned that they were struggling to do a study in a specific city but was lamenting how hard it was to find data for them. Naturally, I suggested using OSM.
While not outright shot down, the idea was politely dismissed, citing that the OSM data is simply too unreliable and not detailed enough to perform the kind of analysis that they wanted. My initial reaction was to jump to the defense of OSM, but I realized that I don’t really know the data quality of this specific corner of the database.
I was already planning to attend the Karlsruhe OSM hackacthon at Geofabrik on February 26th and 27th, and so I decided I would make it my mission to analyze the quality of the charging station data as deeply as I could in those two days (and some time thereafter). Obviously, as with any analysis of OSM quality, seemingly simple questions balloon into exponentially difficult answers, fraught with tedious subtleties.
Despite this, I have come to a few conclusions that I thought I should share that are specifically targeted at assessing the quality of OSM charging station data for use in electrical engineering research. First, here are some definitions I will use so as not to repeat tedious, specific technical definitions:
- Charging station: An OSM feature tagged with “amentiy=charging_station”
- Charging station point: Such a feature with a “node” geometry type
- Charging station polygon: Such a feature with a “way” geometry type

There are numerous standards and tagging practices being used to map subdivisions in the Philippines. Here I listed some of the current practices, and my own standard that aims to be more fitting for subdivisions.
Note that I am referring to gated subdivision communities (that have the block lot scheme) and not barangays that happen to be named with a “subdivision”.
Current practices
Below are some that I have seen and the problems with it.

Back in July 2022, I started mapping schools in Chandigarh. Now that I’m thinking, it wasn’t mapping schools (Oberaffe had already marked areas and added amenity=school tags a decade earlier) but adding names and a bunch of other information tags to those. It was a fun little activity which lead, in my estimate, touching of all schools (and a bunch of colleges as well), which numbered ~200 in Chandigarh and periphery. Areas where I had issues adding data have been populated with fixme tags for in area mappers to help out. Most of the data has flowed to downstream applications like OSMand and Organic maps, which look nice and full now, just like all the yellow areas on standard map.
On to the next adventure, to mark schools (and colleges) in Panchkula; Chandigarh’s next door neighbor.
So, I went to visit a friend in Westport, Ireland for a few days, stopping in Dublin on the way. I tracked all the bus routes and painstakingly added them to OSM during my stay and when I got home. There were five bus routes in total:

This is a cross-post from my blog.
This post is a follow-up on my series on GoPro Max panoramic imagery capture for Mapillary. Find part 1 here and part 2 here.
To capture true 360 degree images with a camera that has just two lenses, compromises are unavoidable. Optics dictate that a lens that captures a 180 degree field of view will have some image sharpness falloff at the edges of the field of view. I hadn’t considered this when I first started capturing with the GoPro MAX. I just mounted it the way I would a regular GoPro and didn’t give it another thought:
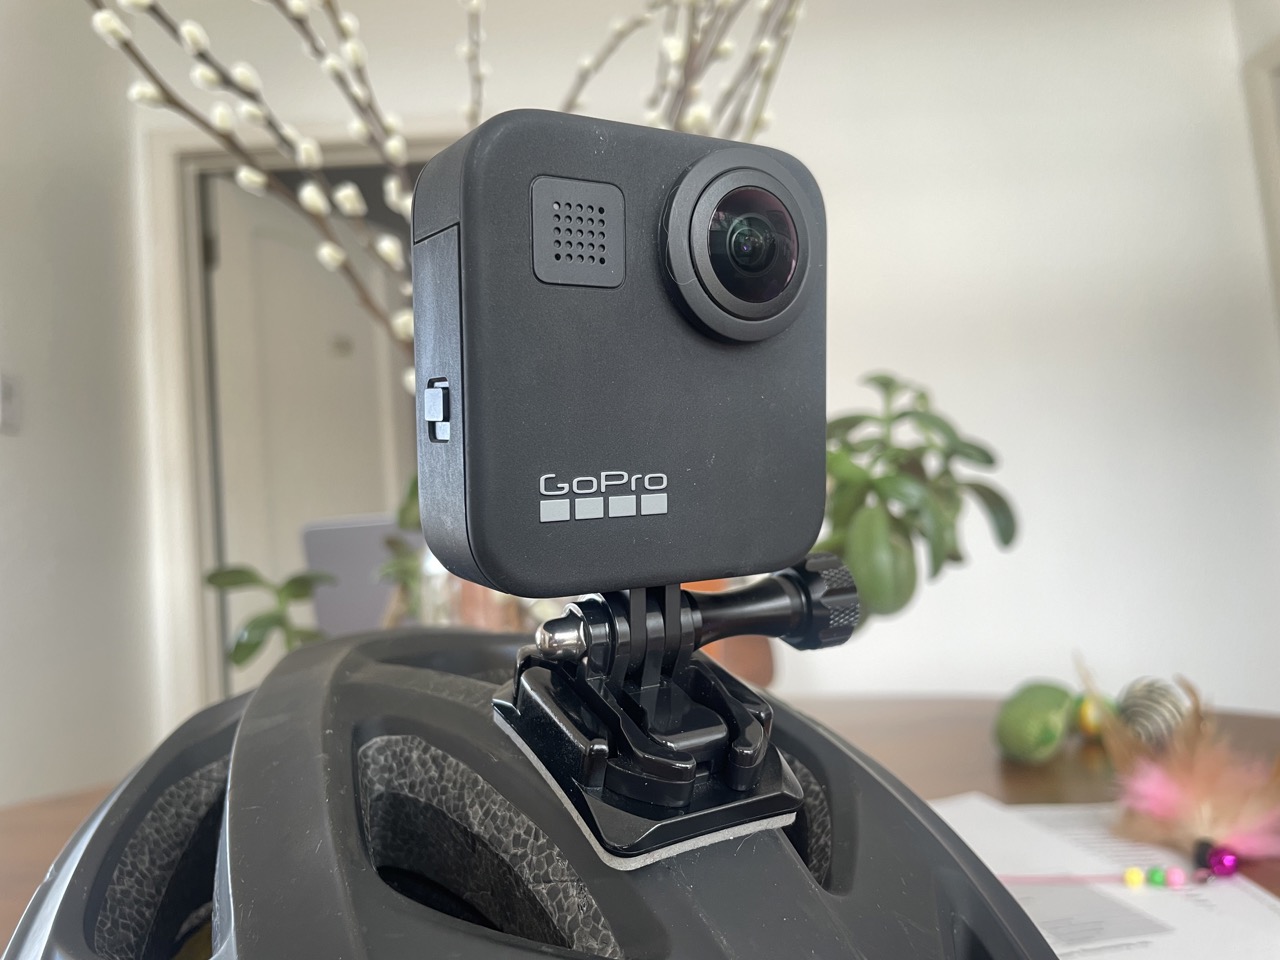
Until I started looking at the result more closely. Here’s a detail of a recent capture:
This diary entry contains a wrap-up of discussions on the osm forum, (dutch section and general section). I’ve tried to capture all that has been said into a logical narrative and solution proposal.
Improved mapping of embankments
Objective
Establish improved mapping of embankments. This includes small embankments and large embankments; one-sided, two-sided and irregular embankments; embankments to contain and to protect against water, embankments to support roads and railways, and embankments serving as a traffic barrier, visual barrier or sound barrier. The aim is mainly to enable fuller rendering on maps, including at least the extent of the slopes. It is NOT the intention to establish full mapping of all aspects of embankments. However, it also should not exclude richer mapping of embankments in the future.
Starting point
Embankments can currently be mapped as:
embankment=yes on a way on the crest of the embankment.
This is especially useful if there is a road, track or path on top of the embankment. Some renderers also handle a single way tagged only with embankment=yes, without a main tag.
The tag can modify the rendering of the way, to suggest it is supported by an embankment. Comparable to how a way can be altered by the tag bridge=yes.
Other non-approved values are sometimes used, e.g. embankment=dyke for a way on a dyke/dike/levee.
There is no established way to indicate further details of the embankment itself, e.g. left/right differences, landcover or surface, steepness, width. Theoretically one could add details like embankment=right and embankment:right:width=5 but this currently is not done. We don’t propose or oppose that.
inizio oggi l’aggiunta delle ciclabili del comune di Alba, uso come traccia https://www.comune.alba.cn.it/images/stories/UfficiEservizi/opere-pubbliche/Lavori_pubblici/PUMS/FaseB/Tavola6PisteCiclabili.pdf e alcuni filmati del sopralluogo. EDIT 2023-10-16: conclusa la verifica, molte erano già presenti, alcune le ho corrette leggermente, la rete, se così si può dire, non è molto estesa e connessa.
Some background
If you’re new to this wonderful dataset I encourage you to read the OSM GNIS wiki entry or play around with the public GNIS web portal. Try feature ID 1629903!
The most important bits from a summary record are the feature Name, Class, and Coordinates.
Last fall, a group of mappers coordinated to address the name updates for Department of Interior Secretarial Order 3404. We cobbled together a collection of data scrapers and spreadsheets and declared victory a few weeks later. Since then, Kai and I have been thinking “there has to be a better way”.
What can the matcher do?
For any entry in the GNIS National File we can ask the matcher to search OSM. It does this using a private Overpass instance and a set of heuristics about likely tag combination and feature types. With reasonably high fidelity we can:
- Find GNIS entries that are very likely not yet added to OSM
- Find OSM objects that look incomplete or incorrect
- Missing GNIS tag
- Missing/different name from GNIS
- Have a geographic bounds that does not agree with GNIS
- Generate MapRoulette challenges for subsets of the full GNIS dataset
What does it look like in practice?
We’ve generated a handful of MapRoulette challenges to check the functionality and see how it improves mapping. Here’s some examples that show off different feature types:
Sq___ Rename Validation - Final cleanup of rivers and other natural features listed in Department of Interior Secretarial Order 3404. It’s very good at noticing if a named waterway is mapped up the wrong tributary.
King County WA Place Update and San Diego County CA Place Update - Urban neighborhood names for the most part. This kind of task really does require local knowledge as the geo information for this class isn’t super precise.
Add and update Mobile Home Parks in AZ - Also from the “place” feature class but for an under-mapped feature type in OSM. This one ties nicely into a project run by MapSwipe and YouthMappers.

Note: il y a une version française ici
From 2019, the cartographic style OpenArdenneMap is updated every 6 months. OpenArdenneMap is a cartographic style for topographic maps based on OSM data. Here are some notes for the last version.
OpenArdenneMap goes on QGIS
OpenArdenneMap was originally developed as a cartographic style with the imposm importer and a cartoCSS style derived from OSMBright. Later the osm2pgsqlimporter was used instead of the imposm. From 2023, the OpenArdenneMap is also available in QGIS, using the same osm2pgsqlimporter for building the map layers.
The tools used for making maps have some influence on the cartographic style itself. The aim of this QGIS support is to reproduce the same feeling than the maps produced with the Mapnik/cartoCSS style, even though the 2 solutions are not 100% equivalent.
Although it still requires a postGIS database, the QGIS style is much simpler to use for composing maps at various scales than the Mapnik/cartoCSS one. It was also much simpler to set up.
Here’s an extract with Mapnik
The participation of women in activities has fairly increased over years but there are still some gaps that need to be filled and you find that women are missing or are not represented as much as they should. Then the question comes into being that what is preventing these women from participating even though there are opportunities available to them. Is it that they are just not interested or there are unseen / unheard stories that block them from participating?
In view of that I am conducting a survey on Women Participation in OpenStreetMap: Perspectives of all Genders and I will need your help in answering some survey questions.
The summary of the concept is it aims to examine the participation of women in OpenStreetMap from the perspectives of all genders, to identify the gaps that exist, and to determine how best to encourage those who identify as women to participate in OpenStreetMap. Hence a survey to source for the opinions of people. Happy to help answer these survey questions which will take less than 10mins of time :), kindly click the link here
The data gathered will be analyzed and a report will be written to inform the development of programs geared towards the participation of women in OpenStreetMap
However, a few studies have been conducted to analyze the gender distribution of OSM contributors, and the results suggest that women are underrepresented in the OSM community. Read more about the concept here
Thank you :)

About a year ago, we launched a mapping campaign at the request from Visit Flanders (Toerisme Vlaanderen). This mapping campaign is focussed on some touristical POI, such as charging stations for ebikes, benches, picnic tables, public toilets and playgrounds. FOr this, a custom mapcomplete theme was created. (For a full explanation, see the last paragraph)
A part of the campaign involved a guided import. The agency had many datasets lying around (e.g. about benches or picnic tables) which they wanted to have imported in OSM. As doing a data import is hard and the data was sometimes outdated, we opted for a crowdsourced approach: for every possible feature, a map note was created containing a friendly explanation, information links, the tags to create and instructions to open MapComplete.
When opened in mapcomplete, the user would be prompted to import the point or to mark it as not found or duplicate. All of these actions close the note with a small message on what the chosen action was.
Most map notes are closed by now, but the central question in this analysis today is: should remaining map notes be closed in batch, or do we leave them open for longer? Note that input of the local community will be gathered as well - this article will mostly serve as a point to start the discussion.
The datasets
Various datasets were provided to upload - which were converted into notes. In the table below, you’ll find a breakdown by topic, the date when they were uploaded, the number of notes created and how much of those notes were already closed and the top contributors for the category.
In this table, I’m not including if the feature has been added to OpenStreetMap, has been marked as not existing anymore or marked as being a duplicate.
Most of those notes have been opened by a dedicated account, except for two imports which accidentally did not use this account (noted in the table below).

Today, I spent the day working on my Open Street Mapping project. Specifically, I was focused on using Leaflet mapping for sports team transport management. This project is very important to me, as I believe that it will make a huge difference in the way that sports teams are able to travel to their various events.
First, I spent some time exploring the different features of Open Street Mapping, and learning how to use Leaflet to create interactive maps. I was amazed at how much data is available on Open Street Mapping - everything from street names to building outlines to points of interest.
Next, I began to work on my project in earnest. I started by creating a map of the area where the sports teams are located, and then began to add in the locations of all the different sports facilities and venues where they might need to travel to. I also added in information about the different modes of transportation that the teams might use - everything from buses to trains to airplanes.
As I worked, I was struck by how much easier this project was making things for the sports teams. With this interactive map, they will be able to quickly and easily see the best routes to take to their various events, and will be able to avoid traffic and other delays. They will also be able to see all of the different transportation options that are available to them, and will be able to choose the one that is most convenient and cost-effective.
Overall, I am very excited about this project and the potential impact that it could have. I am looking forward to continuing to work on it, and to seeing the ways in which it will make a difference in the lives of sports teams and their fans.
111dada

In the UK and Ireland stone circles are amongst the oldest built structures. They are usually mapped with historic=archaeological site, archaelogical_site=megalith. megalith_type=stone_circle. However, mapping in Wales it is soon apparent that there are quite a few modern ones.

Most are Gorsedd Stones, relics of National Eisteddfodau. However there’s a small covey near the entrance of the show cave at Dan yr Ogof. Most are mapped as monuments or memorials, although I think when the Eisteddfod returns to a site they are used for their original purpose.
Ecolieu des Perrières