Users' Diaries

Recent diary entries

Posted by ZeLonewolf on 10 January 2023 in English. Last updated on 11 January 2023.

The Americana vector style uses OpenMapTiles as its backing data schema. When the project desires to add a new feature that isn’t available in OpenMapTiles, someone from the team typically submits a PR to add it. Eventually, OpenMapTiles will create a release, which gets picked up by the Planetiler OpenMapTiles profile, after which I would re-render the planet on an AWS instance. This process from end-to-end often takes months before we see the results at planet scale.

Because planetiler’s update cycle follows OpenMapTiles, contributors need to use the older openmaptiles-tools, which can take days, weeks, or even months to render a planet, depending on how powerful the developer’s computer is.

Therefore, when testing a change to OpenMapTiles, a contributor would typically test their changes on a small area, with a command like:

./quickstart.sh rhode-island

This command would download a PBF extract from Geofabrik, and run a series of scripts that ultimately produce an .mbtiles file of Rhode Island. If you’re testing a feature that appears at high zoom, you can edit .env and change the setting to render down to the maximum zoom of 14. Because Rhode Island is so small, a full-depth render only takes a few minutes.

However, what if you are testing a low zoom feature like an ocean or sea label? If you need to test whether the Atlantic Ocean label is rendering properly, there is no extract short of the planet that will contain an ocean.

The solution for developers working with these features is to download the planet file, and then pre-filter it using the tags-filter feature in osmium tool for just the features that you care about testing at low zoom, and then render that into tiles.

First, you download the planet pbf file:

AREA=planet make download

This will download a file planet.osm.pbf into the data/ folder.

See full entry

Location: 61.418, 20.566

What licenses are used?

Now that MapComplete is two-and-a-half year old, it’s a good time to see what license people are using to upload their images.

Why do I care?

The first reason to do this research is curiosity. How much pictures are uploaded with what license?

The second reason is a very practical and UX-driven: if a significant portion of contributors doesn’t bother to change the license, then the license picker can be moved from the ‘infobox’ into the ‘user settings’, freeing up valuable space there. User tests have pointed out that this is valuable.

Methodology

MapComplete uploads images to imgur.com and then links to this image using image=https://i.imgur.com/aBcDeF123.jpg. Some metadata (most notably the author and chosen license) is added as ‘description’ to the image on Imgur. If multiple images are added, then keys image:0, image:1, image:2… is used.

At last, themes can also add images under a specific key. For now, only the etymology-map does this with image:streetsign.

Overpass was used to download all features with a tag matching one of the described keys and matching an imgur-url.

Then, the description of all those images is downloaded and parsed, yielding the needed metadata.

Even though some people did add images to imgur to link them to OpenStreetMap before, we assume that (nearly) no images will also have the license information encoded as MapComplete does. Furthermore, this does not keep images of now-deleted features into account, nor does it take images into account that have been deleted in the mean time. I don’t think it’ll make a big difference though.

The resulting datasets are here. The script to download this all is in the MapComplete repository. Keep in mind that using this script will exhaust the daily IMGUR rate limit; so please use a different access token or spread the download over two days as was done for this research.

Results

See full entry

Edit: When I tried to add this, the MapComplete account got caught in the spam-filter (rightfully so), so I published the report on my personal user diary.

To keep the discussion in one place, I’m removing the entry here

osm.org/user/Pieter%20Vander%20Vennet/diary/400716

Posted by steveman1123 on 9 January 2023 in English.

Most of my mapping is done via “armchair mapping”, using aerial imagery to add buildings and features around. I’m thankful that where I live, I have high quality, and relatively recent aerial imagery. Because most of what I map tends to be residential (since in order for the map to be useful to people, they want to know that where they live is actually present), I find that I add a significant number of houses, garages, and sidewalks/footpaths. When available, there are open data sources for addresses, so I’ve found that adding data in stages seems to help.
The first stage being correcting roads that haven’t been touched since the Tiger imports, fixing and adding land use such as residential or retail or farm areas, adding paths and other routing features.
The second stage I add buildings such as houses, retail, and whatnot, fix imported church and post office/official building locations based off internet search addresses and educated guesses (e.g. does the building look like a church or have white vehicles nearby? Then it’s probably the nearby labeled church or post office, etc. Also does searching for {town name} and eg “baptist church” etc yield usable results like a website? Sometimes not, but most often yes).

In addition to buildings, I like to add power poles, fire hydrants, and other service things like benches, street lamps, etc if they’re present and I can see them on the aerial imagery (or can assume they’re there from wire locations and other context clues).

See full entry

In 2020, the Queensland Government Department of Natural Resources, Mines and Energy (DNRME) made a statement in regard to the CC:BY 4.0 datasets made available through their Queensland Spatial Catalogue (including their Digital Cadastral Database (DCDB)).

Nemanja Bracko posted the statement at https://github.com/microsoft/Open-Maps/issues/49

Can I highlight this passage from DNRME’s statement:

“data accessible from the Queensland Spatial Data Catalogue […] licensed under the […] CC:BY 4.0 licence […] permits OpenStreetMap to copy and redistribute the data, and remix, transform and build upon the data for any purpose”

This statement is expressing DNRME’s intent in respect of their CC BY 4.0 data. It essentially functions as the “explicit permission for use in OpenStreetMap from licensors of CC BY databases and data” contemplated in https://blog.openstreetmap.org/2017/03/17/use-of-cc-by-data/

Additionally, section 2.a.5.B of CC:BY 4.0 contemplates “Technological Effective Measures”, but the DNRME’s view is that Technological Effective Measures are no matter: DNRME also permits its CC:BY 4.0 data for any purpose.

Thank you, Nemanja, for making the enquiry and posting the DNRME’s response.

Posted by SK53 on 9 January 2023 in English. Last updated on 11 January 2023.

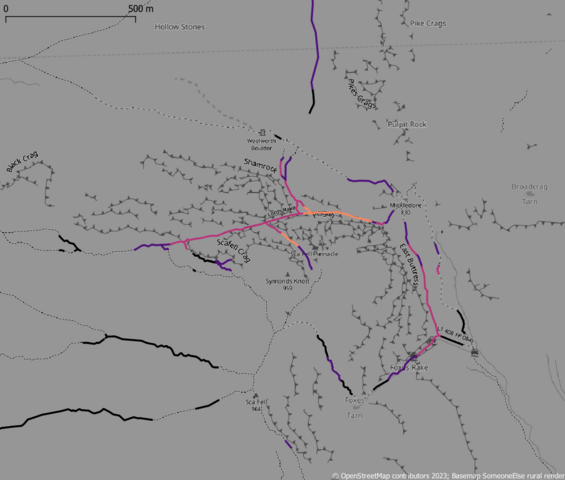
Lord's Rake, Scafell - geograph.org.uk - 1329625 Lord’s Rake: one of the steepest paths marked on OSM in Upper Wasdale

In my last diary I introduced the idea of using elevation models (DEMs), specifically a DTM (terrain model) to find sections of hiking paths on OpenStreetMap which may cause problems for regular hikers. In this sequel I describe a refined approach using a higher quality terrain model and a vertex-based approach to calculating slope angles actually likely to be experienced by walkers.

See full entry

Location: Wasdale, Cumberland, England, United Kingdom
Posted by dcapillae on 9 January 2023 in Spanish (Español). Last updated on 6 June 2026.

Punto limpio de proximidad Punto limpio de proximidad (minipunto limpio) de la empresa de limpieza municipal del Ayuntamiento de Málaga en la plaza John Fitzgerald Kennedy. Fuente: trabajo propio (CC BY-SA 4.0) disponible en Wikimedia Commons.

Como comentaba hace algunos meses, el Ayuntamiento de Málaga tenía previsto instalar 14 minipuntos limpios para reciclaje distribuidos por los once distritos de la ciudad. Ya están disponibles estos minipuntos limpios, denominados ahora puntos limpios de proximidad. La empresa municipal de limpieza, Limpieza de Málaga SAM, los ha instalado esta mañana y el Ayuntamiento lo ha anunciado a través de una nota informativa (702.8 KB).

En estos puntos limpios se podrán reciclar pequeños electrodomésticos, pilas, cápsulas de café, lámparas de bajo consumo, aceite, tóneres, libros y revistas, tapones, radiografías, cintas de vídeo, discos compactos (CD), tubos fluorescentes, aceite y aerosoles.

See full entry

Location: Ciudad Jardín, Málaga, Málaga-Costa del Sol, Málaga, Andalucía, 29014, España
Posted by Zainab Ramadhanis on 9 January 2023 in English. Last updated on 20 June 2023.

November 2022 was such a pleasant moment because I participated in the State of the Map Asia for the first time. I always wanted to join the SotM in person since 2020 after participating in lightning talk SotM 2020. In 2021, I didn’t have chance to submit my research result because I just finished it on early July. So, I proposed myself as a translation volunteer for Bahasa Indonesia (see SotM 2021).

In 2022, I also planned to join SotM 2022. However, I couldn’t join because I was very busy with my thesis and had to graduate before September 2022. I thought I didn’t have a chance to join any OSM event in 2022 before my friend sent me an Instagram post that Open Mapping Hub Asia-Pacific was looking for scholars. There were three categories of scholars: community nomination, mapping, and map-making poster. I decided to submit in map-making poster category because I didn’t participate at all in OSM local community in Indonesia since I lived in Taiwan to study, and I didn’t contribute much to OSM in 2022. I created the map-making poster about the quality of road data OSM in Jakarta by comparing the OSM data and local government data (see my poster here). Thank you Open Mapping Hub Asia-Pacific for this amazing chance!

I arrived in Legazpi City, Philippines on Sunday, November 19, 2022. Mayon Volcano became the first thing that I saw when I landed at Legazpi Airport. The scenery of Mayon Volcano was very beautiful, I didn’t take a proper picture at that moment, but I took a good one when I visited the Cagsawa Ruins on Tuesday (11/22).

State of the Map Asia 2022 was actually different than any SotM Asia events before, as it collaborated with Pista ng Mapa (Festival of Maps), so the conference was quite long, five days in total. But I didn’t complain, because all the presentations and workshops were totally fun!

See full entry

Location: RW 02, Gambir, Central Jakarta, Special Capital Region of Jakarta, Java, 10110, Indonesia

Demo narzędzia

Właśnie wydałem nowe narzędzie osm-revert dla społeczności OpenStreetMap. W założeniu jest to bezpośredni następca do RevertUI. Jest to szybszy i skuteczniejszy sposób na wycofywanie zmian na mapie. Korzysta z Overpass API, aby zredukować ilość zapytań do serwerów, co czyni go szybszym w procesie odwracania. Potrafi także automatycznie rozwiązywać konflikty, co było niemożliwe w przypadku poprzedniego narzędzia. Dodatkowo, nie posiada ograniczeń dotyczących rozmiaru zestawu zmian, co pozwala na cofnięcie nieograniczonej liczby zmian w jednym zestawie.

See full entry

Posted by NorthCrab on 9 January 2023 in English. Last updated on 11 August 2023.

Tool demo

I released a new tool called osm-revert for OpenStreetMap community. It’s aimed to be a direct successor to RevertUI. It’s a faster and smarter way to revert changesets on the platform. It uses the Overpass API to reduce the amount of API calls, making it faster at reverting changesets. It can also automatically resolve conflicts, something that the previous tool, RevertUI, couldn’t do. Plus, it has no limits on the size of the changeset. This solves problems like changeset too big and node and way conflicts.

See full entry

Hi all, I’ve written a new post based on OpenStreetMap data on roads, landuse and other features in Australia, to answer the question: is the total length of roads within towns and cities less or more than the total length of roads between towns and cities. Town boundaries were generated from OSM’s landuse, leisure and other tags. Hope you find something of interest. Cheers.

https://little-maps.com/2023/01/09/city-or-the-bush-where-are-the-most-roads/

Have you ever taken a look at your own mapping done over a year or two ago? If you haven’t yet done that, take a few minutes and check out some old projects or areas you have mapped. A few questions you might ask yourself upon a glance at your own mapping would be; Did I really map these features?; What happened to my mapping skills?; How could this happen? Of course! that is you.

But you should rest assured that is not your doing. I came across an area mapped by an experienced mapper who was and has been my inspiration since I joined the OSM community and at the first glance I was disappointed. But upon checking the history of the mapped features, I realized the digitization was done years back.

This realization brought back theories I learned in class during my undergraduate studies. “Maps do not stand the test of time”, meaning they are easily outdated. But this is true when it comes to paper maps since it takes a lot of money and effort to make them and yet they do not last in terms of representing newer environmental development.

Its a different story for OSM, yes area never gets mapped, but we can constantly keep updating data to catch up with the ever-evolving and ever-changing environment so that the world does not classify OSM data are not good enough. Let’s Keep Mapping Daily, The Work Never Ends!

Location: Obenyade, Tema, Tema Metropolitan District, Greater Accra Region, Ghana

I’ve run across a few places where there seems to be some disagreement and confusion about how to distinguish between roads that should be tagged as highway=service versus highway=track. I see quite a few ways that get switched back and forth between the two tags each time a different mapper touches them.

So I figured I’d write up how I make the distinction. I understand that other mappers might think about these things differently, but here’s how I think about the two types of roads.

Service roads (highway=service) are:

  • used to provide motor vehicle access from a through road or a local road to a specific destination (building, etc.)
  • typically very short
  • typically used for a single purpose
  • often one lane (although sometimes wider)
  • typically not named or numbered (i.e. no name or ref tags)

Some examples of highway=service: a driveway, an urban alley, a parking aisle, a short access road for utility equipment, an access road leading to one or more campsites, or an access road in a municipal dump.

Track roads (highway=track) are:

  • local roads that are only wide enough for a single four-wheeled vehicle (i.e. dual-track on the ground)
  • can be short or long (i.e. many miles)
  • typically used for multiple purposes
  • typically named and/or numbered when they are approved public routes of travel

Some examples of highway=track: a dual-track dirt road, a remote single-lane paved road, a graded single-lane road along a canal or railway, or a dirt road along the path of a power line.

The place that seems to cause the most confusion is where a longer road is used to access some sort of infrastructure. For me, this is typically a highway=track. Although roads like this can be used to access infrastructure (e.g. towers for high-voltage power lines) they can also be used for through travel, recreation, and other purposes. Roads like this are often designated for multiple uses by the land manager responsible for them.

See full entry

Posted by SK53 on 8 January 2023 in English. Last updated on 11 January 2023.

Recently there has been quite prominent press coverage of mountain rescue incidents in the English Lake District involving people using various outdoor activity apps (The Guardian, Grough). It turns out that these incidents involved paths mapped on OpenStreetMap, and have been discussed by the local UK community.

Steep paths on OSM around Scafell (brighter is steeper)

See full entry

Location: 54.449, -3.223
Posted by SimonPoole on 8 January 2023 in English. Last updated on 2 May 2024.

I haven’t done a contributor statistics diary post in a long time, but I suspect that the latest update of the graphs on the wiki is likely to lead to some questions.

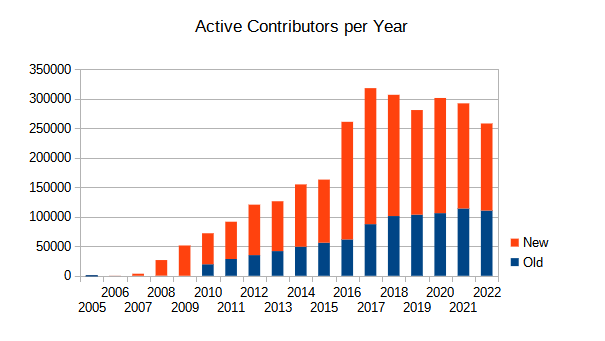
As we can see in

active contributors per year

the number of new contributors to OSM has dropped quite a bit in 2022. As the overall number of contributors has always been dominated by the new contributors it isn’t a surprise that the overall number is down too.

The interesting question is if we can pinpoint any “source” of this reduction. As a 1st investigative step I gave the numbers for editing apps used by new editors a look. I’ve been producing the numbers for a long time, but have never published them previously, if we look at 2021 and 2022 we see:

See full entry

Posted by Quite Frankly on 8 January 2023 in English. Last updated on 22 September 2023.

I am embarking on a project documenting and updating bike lanes throughout Melbourne, and eventually Victoria, in as much detail as possible. This work draws on a range of sources including aerial imagery, street-level imagery, local surveys, other OSM users, and input from councils. I am drawing on global tagging conventions, and other tagging schemes developed specifically for detailed documentation of cycling infrastructure such as here and here.

In the first iteration I will capture the most basic attributes, such as whether a lane exists and if so, what basic category, e.g. exclusive, advisory, shared, separated, etc. If a survey reveals no lane, I mark the way explicitly as cycleway:side=no. Otherwise, the type of lane is captured using cycleway:side=? and cycleway:side:lane=? (side = both/left/right, depending on the way). See this tagging guide for specifics.

This step in itself is quite a large undertaking, and I’m finding even this basic categorisation can be somewhat subjective in cases where cycle lanes haven’t been properly maintained or markings are particularly sparse or unclear. I will post some examples of these edge cases in due course.

Note that where a cycleway tag already exists on a way, but I cannot validate its accuracy, I will not remove the tag. I will only update existing tags if I can confirm the tagging is incorrect, outdated, or could benefit from more detail (such as specifying :side and/or :lane).

Following this, I intend to add additional attributes such as lane width, buffers, separation type, traffic calming, etc. as well as updating the off-road network. This work aims to support better city planning, journey planning and cycle route suggestions across the state.

I have nearly completed the first sweep of City of Melbourne, City of Darebin, and City of Casey and am currently in the process of validating this with these councils.

See full entry

Location: Melbourne, Victoria, Australia

Wprowadzenie

Stworzyłem stronę https://starsep.com/osm-wtp/. Można na niej znaleźć porównanie danych OpenStreetMap transportu publicznego aglomeracji warszawskiej z danymi Warszawskiego Transportu Publicznego. Głównym celem jest możliwość łatwego znalezienia błędów oraz brakujących danych. Porównuję dla każdego wariantu linii listę przystanków. Dodatkowo znajdowana jest część błędów związanych z tagowaniem w OpenStreetMap.

Treść strony

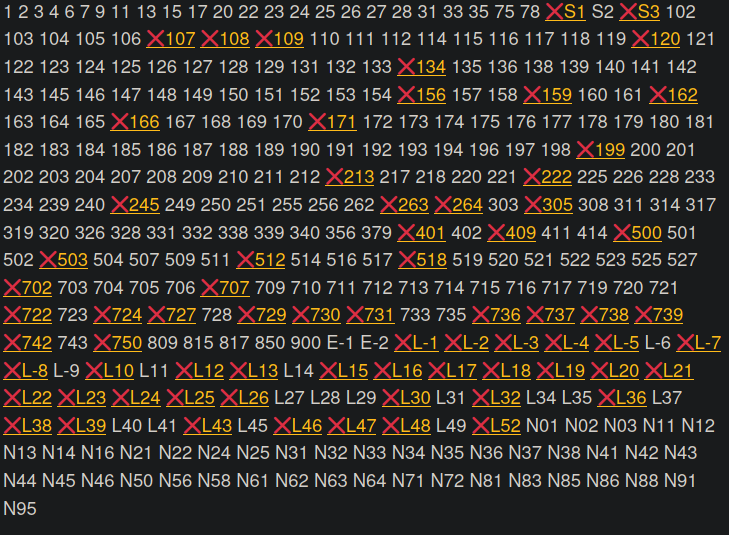
Na górze znajduje się lista linii. Dla linii z błędem wyświetla się link z ❌.

lines

Dla linii z błędami wyświetlone są tabelki porównujące nazwy i numery przystanków z OSM i WTP. Kolory oznaczają, co należy zrobić w OSM, aby doprowadzić do stanu z WTP: zielony dodać przystanki, czerwony usunąć, pomarańczowy zmienić. W nagłówku są przydatne linki.

See full entry

Das Thema ist mir zu komplex, um es (gleich) in englisch zu schreiben. Ich bin auch kein Experte, kenne nicht mal die Probleme und Notwendigkeiten so genau. Das hier ist also eher ein Brainstorming mit einigen Schlagworten:

  • Anything will be an area
  • There has always be Vector Tiles
  • Don’t tag vor the Vector Tiles
  • Make the problem to the solution

Area als neuen Objekt-Typ ist nur Tagging-Sugar, die Verpackung wird einsichtiger, der Inhalt bleibt. Ein Kreisverkehr braucht kein area=no mehr, der Spielplatz keine identischen End-Nodes. Trotzdem bin ich dafür. Einige Editoren haben Areas ja auch schon im Interface. Ich sehe in Zukunft immer mehr Areas, auch für Wege. Am Ende ist jeder Fleck Erde Teil irgend eines Areas. Das ist gut für zoomed Rendern, für Rollstuhl-Karten und 3D Rendern. Es ist nur schlecht für rooting; vielleicht sollte im Way-Object eine Hilfe sein, eine Liste zu den anschließenden Wegen.

Vektor Tiles sind im Kern geordnete Informationen für ein Gebiet. Die brauchte man auch schon bei den ersten Bitmap-Renderern. Aus der Tagging-Anarchie wurden, und werden, Objekte in Layer gefiltert. Und dabei wird entschieden, was überhaupt sichtbar wird! Erst im nächsten Schritt werden die Objekte zu sichtbaren Linien, Flächen oder 3D Objekten. Daher dürfen Vektor Tiles nicht das aussehen festlegen und auch nicht bestimmen, was auf die Karte kommt. Allerdings gibt es “normale” Objekte, die jeder braucht und Seltene für Spezial-Karten. Mein Ansatz wäre: Immer zwei Tile-Dateien bereit zu stellen, eine die kompakt alles “normalerweise” notwendige enthält und eine mit wirklich dem ganzen Rest; schräge Sachen notfalls in einen Layer “sonstiges”. Den muß der Rendere dann nach dem Tagging der Objekte selbst sortieren.

See full entry

This is just an initial review and test of the Every Door mobile OSM editor. If you ever added stores and POIs with either a piece of paper and a camera you know that it is a long pain to add all the information to OSM. Even worse is that all your efforts can end up stale and you have to re-fix all the closed or new stores. Enter Every Door, the perfect tool that makes micro mapping or adding / updating POIs a breeze and not just simple things but adding handicap status, telephones, websites, payment information and other fine details are all there. It also has the easiest and seamless Opening hours editor which with a few taps you have it set quickly.

I went back to fixup and remap some shopping centers and places today and it was a breeze. I am able to quickly remove closed stores, quickly add new stores with the easy iD editor presets search and it does everything to streamline the process and give you just the right fields for the given. Adding the phone number is as easy as dialing it, and website as quickly putting in the url no need to worry about the http prefixes it does it for you. This app makes me want to do more field mapping as it takes out all the tedious parts and gets to the exploring and mapping right away with near instant gratification.

If you haven’t already download and try the app. It is for Android and iOS and is even on the F-Droid app store. So try it out I want more people to know about this as I am glad I found out about the app.

https://every-door.app/

Posted by mvexel on 6 January 2023 in English.

After tinkering a bit but finally successfully processing videos from my Viofo A129 dash cam and uploading them to Mapillary, there is one last thing I wanted to try: using the A129 time lapse mode to be able to collect more imagery before the storage space on my camera runs out…

This does not seem to be possible without recording your GPS breadcrumbs using a separate device, because the location information written into the movie stream by the camera is sparser than the video frames. Using

exiftool -m -p gpx.fmt -ee -ext mp4 -w! %f.gpx time-lapse-movie.MP4

I get 4 trackpoints for a movie that contains about 300 frames.

This could also be a result of limitations in the way exiftool parses the MP4 file, but looking at the relevant documentation section I don’t see a way to tweak this.

What I think I will do instead is:

  • Buy a larger micro-SD card (they are getting cheaper all the time)
  • Reducing the video quality

In order to be able to capture more of my longer trips. I’m about to make [this drive] and I’ll test it then!

Location: 40.740, -111.907