 OpenStreetMap

Voici une alternative pour la création de cartes à afficher sur votre site. uMap permet de créer des cartes personnalisées sur des fonds OpenStreetMap. Si vous passez dans ma région utiliser uMap pour les parcours street art à travers la ville. (http://u.osmfr.org/m/776759/)
Users' Diaries
Recent diary entries
Posted by addsonmap on 23 June 2022 in Brazilian Portuguese (Português do Brasil).

Atividade realizada
## Assunto de estudos com mapas
- Primeiro tempo
- Segundo tempo

Friday December 1, 2006 was 15 years, 6 months, 23 days ago
that is a long time ago …

위키와 같이 뭇사람들이 꾀를 내어 정보를 모으는 곳이 서로 명료하면서도 명확하게 정리하기가 어렵다는 성격을 이해합니다만, 가끔은 좀 너무 세분화하다 보니 비슷한 성격을 제각각으로 나타내기도 하고 그러다 보니 이미 있는 속성이 다른 속성을 다 품기에 모자라기도 하는 점들이 많은 것 같습니다.
(그런 생각이 몇 번 들었지만 매번 모아둔 것은 아니므로 여기서는 한 가지 보기를 들어 얘기를 풀어 보겠습니다.)
성스러운 곳을 나타내는 구조물에 ‘토리이’라는 것이 있습니다.
아시는 분은 아시겠지만 일본에서 신사 같은 곳 들머리에 많이 세워져 있습니다.
하지만 이건 일본 특유의 풍속은 아니고 각 나라마다 비슷한 성격을 가진 구조물들이 있습니다.(그에 견줘 ‘신사’는 일본 특유의 구조물로 보아 줄 수 있을 것입니다.)
비슷한 것으로 우리나라에는 ‘홍살문’이 있으며 ‘중국’에는 ‘패루’(牌樓), 인도에는 ‘토라나’, 타이에는 ‘사오칭차’, 벹남에는 ‘땀꽌’이라는 것이 있습니다.
덧붙이자면 중화문화권 성격이 강한 곳에서는 중국식 ‘패루’를 본뜬 모양이 많기는 하지만(벹남 등) 아마도 그 뿌리는 인도의 ‘토라나’로 보고 있는 듯합니다.(‘위키백과’에도 ‘Evolved from the Indian subcontinent’s torana through the introduction of Buddhism to China, it has developed many styles and has been introduced to other East Asian countries, such as Korea, Japan, and Vietnam.’라고 적어 놨습니다.)
그런데 이것을 OSM에서는 ‘토리이’(torii)-‘도리이’라고 번역-로만 표현이 되며 홍살물(hongsalmun)이나 ‘패루’(pailou)나 ‘패방’(paifang), 심지어 이런 양식의 기원이라는 인도의 ‘토라나’(torana)를 입력하면 그냥 ‘인공지물’로만 표현이 됩니다.
이는 힘센 문화 혹은 앞서 알려진 문화가 권리를 다 가지는 문화제국주의, 문화선점주의라고 생각합니다.(마치 ‘김치’를 변형한 ‘기무치’를 국제 표준으로 인정받는 것과 비슷하다고 보시면 될 것 같습니다.)
이는 신성한 곳을 표시하는 구조물을 나타내는 키로 아울러서 표현하는 것이 맞다고 생각하며 만약 굳이 개별 표현을 써야 한다면 그 기원이라고 인정받는 ‘man_made=torana’가 되어야 맞다고 생각합니다.
만약 그렇지 않다면 (일본에)’토리이’가 있듯이 ‘홍살문’, ‘패루’ 같은 속성도 함께 있는 것이 맞다고 생각합니다.

Better late than never — I thought it’d be good to report back on the OSM meetup we had in March this year in Shenton Park.
We had a great turnout, with about a dozen people, many of whom were new mappers. We met at Lake Jualbup, and spent an hour or so sorting out devices, new accounts, and discussion differences between mapping apps. Morning tea (and later, some of lunch) was most generously sponsored by OSGeo Oceania (the Australian OSM chapter).
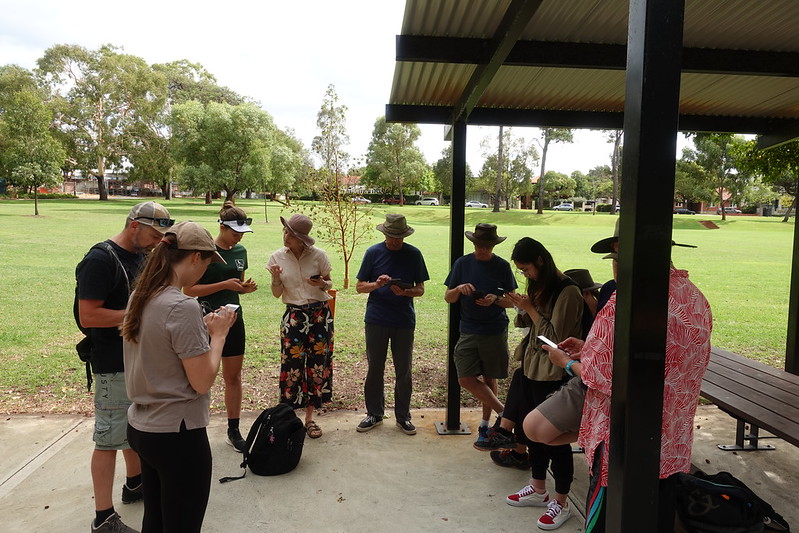
The group took quite a while to amble around the park, mapping bins, dog poo bags, signs, and figuring out how to map an unmarked but obviously intentional path through a garden.
Posted by transpormapas on 22 June 2022 in Portuguese (Português).
Algumas alterações na zona de Algés e Linda-a-Velha por ocasião da nova rede de transportes. Algumas alterações efetuadas: 1. 114 (futura 1502) Algés - Amadora, via Carnaxide 2. 162 (futura 1713) Algés - Falagueira, via Damaia
Have loved OSM for a while now, and decided on a whim to try my hand at mapping my neighborhood of Spokane Valley, before I move to WSU for college.
Any and all tips, tricks, and help is greatly appreciated!
Posted by adreamy on 22 June 2022 in Korean (한국어).
Last updated on 9 November 2022.
OSM에서 건물(building)을 그릴 때는 (굳이 입체로 표현하지 않는다면)대개는 그 옆 모양에 얽매이지 않고 위에서 봤을 때의 모양을 따서 그리기로 되어 있고 저 역시 그리 했습니다만, 이 수는 꽤 큰 문제가 있다고 생각이 들었습니다.
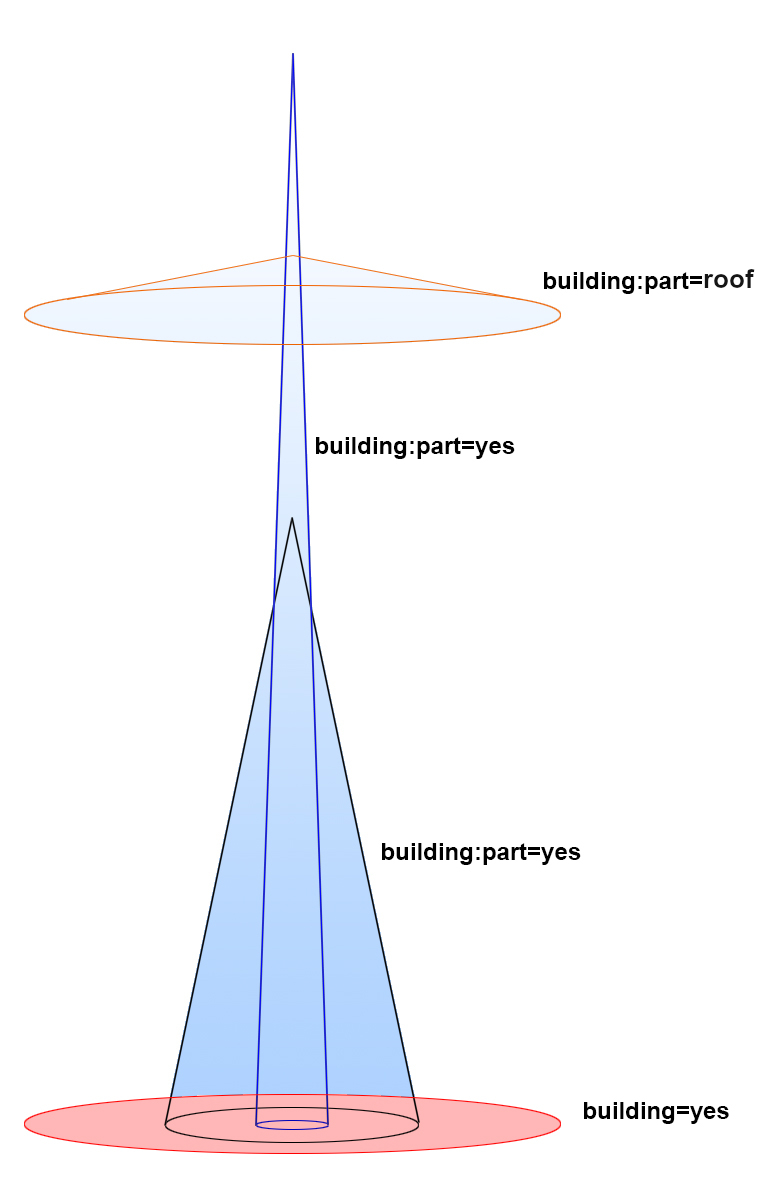 물론 제대로 그리려면 지상부터 맨 위까지 모든 공간이 쓰이고 있는 부분과 그렇지 않은 부분을 나눠서 그려야 하겠으나(층 수가 낮은 부분이나 가운데가 비고 그 위에 쓰이는 공간이 있는 경우 등:지면에서 시작하지 않는 부분을 가진 건물) 모든 건물을 처음부터 그런 식으로 그리기는 어려울 것입니다.
하지만, (OSM에서)’고정된 기둥’과 ‘갖춰진 시설물로써 지붕’이 있는 것을 ‘건물’(building)로 본다 하더라도, 그릴 때는 제 구실을 하는 부분과 ‘큰 기능은 없는’ 부속 부분은 나눠서 그릴 필요가 있을 것 같습니다.
물론 제대로 그리려면 지상부터 맨 위까지 모든 공간이 쓰이고 있는 부분과 그렇지 않은 부분을 나눠서 그려야 하겠으나(층 수가 낮은 부분이나 가운데가 비고 그 위에 쓰이는 공간이 있는 경우 등:지면에서 시작하지 않는 부분을 가진 건물) 모든 건물을 처음부터 그런 식으로 그리기는 어려울 것입니다.
하지만, (OSM에서)’고정된 기둥’과 ‘갖춰진 시설물로써 지붕’이 있는 것을 ‘건물’(building)로 본다 하더라도, 그릴 때는 제 구실을 하는 부분과 ‘큰 기능은 없는’ 부속 부분은 나눠서 그릴 필요가 있을 것 같습니다.
Hello

Опубликовал Памятку сообществу для картографирования Павловского парка, которую любезно подготовил MosKartograf. Закончил работу над Парадным полем и приступил к самому обширному району парка - Белой Березе.

I use a few plugins and presets that help me map faster and better with JOSM. I recommend them as basics for people who are starting to map, or even experienced mappers if they find them useful.
Plugins
- FlatLaf: Dark theme for JOSM across all platforms. This isn’t needed but it makes JOSM way easier on the eyes.
- Gridify: Generate grids using an area. Very useful for generating parking spaces quickly.
- OpeningHoursEditor: Visual editor for opening hours
- utilsplugin2: Adds various tools to JOSM I find useful, personally circle arc is my favorite because it lets you create smoother curves and turns on roads, sidewalks, and the such.
- easypresets: Create more specific presets of existing presets for faster editing.
- buildingstools: Draw rectangles quickly. Combine this with Advanced mode on and Create Areas (built into JOSM when Advanced is on) can make adding buildings really, really fast!
Tag Presets
I only use one tag preset called Name Suggestion Index. This allows you to mark businesses with their proper name, wikimedia tag, amenity, etc. This is the same index that iD uses for its suggestions, so this will give you very similar tag presets that iD does. I find this very useful for people moving from iD.

I would like to tell you about another small project I will be working on for the next months. It is made possible by a NLNet NGI Zero Discovery grant:
Missing maxspeed
Inferring default speed limits for situations where concrete maxspeed information is missing. Last time I checked, only 12% of roads had this tagged at all and while the number of roads tagged with maxspeed of course is increasing, so is the number of roads.
Compared with highway=unclassified, it looks pretty much like a zero sum game.
This means, that not only did OSM based router software always have to fill huge holes in data to produce reasonably precise ETAs (etc.), it is also not something that will get any better on a global scale in the foreseeable future.
Why so sketchy?
It’s also understandable why the data is so sketchy: Roads can simply be traced from satellite imagery. Finding speed limit signs on the other hand often requires to look for them on-site or via good Mapillary / KartaView coverage which is in itself already much more time-intensive. Not only that - it’s even more time-intensive to confirm that there is no signed speed limit for a given segment of road as the speed limit sign could be located all the way down the road. (One reason why the speed-limits quest is disabled in StreetComplete.)
Finally, if it turns out there is no sign, tagging the correct maxspeed requires knowing the traffic legislation in the country one is mapping in. (And sometimes one errs in what one thinks is correct. Did you know that the default no-speed-limits in Germany are technically are not limited to the Autobahn?)
Goal
Posted by Puxan on 20 June 2022 in Spanish (Español).

Hoy al finalizar el proyecto 7133 en el que he trabajado, he tenido la curiosidad de buscar edificios duplicados. He encontrado unos 120. No son muchos, pero creo que demasiados para pasar por alto al validador que dió por buena la tesela. Normalmente estaban concentrados. Al hacer la descarga mediante consulta overpass es difícil asignarlo a una tesela concreta.
Hay dos situaciones totalmente distintas: en la mayoría de ocasiones un mapeador mapeó un edificio superponiendolo total o parcialmente a otro. La otra situación me es más dificil de explicar como puede suceder. Se trata de una sola vía que tiene dos veces la etiqueta building=yes. El editor permite poner dos veces la misma etiqueta. No me he fijado en el editor, ni en el tiempo entre etiquetas, ni en si es el mismo mapeador u otro distinto. Creo que si lo estudio más podríamos conseguir que el editor evite esta situación
Posted by b-unicycling on 18 June 2022 in English.
Last updated on 20 June 2022.
First of all: North Wales is lovely, and I’d definitely go there again.
I went for a short holiday to North Wales with DeBigC this week and did a lot of mapping while there, but that was intended. Let me break down what we did:
Mapillary
Very little mapillary had been done, so we walked around (I’m especially pleased with the walk on the Conwy town wall) and also captured as much as we could on the buses we took (see below). Capturing mapillary on the bus has the advantage of getting a slightly different perspective than on the car. The disadvantage is that we didn’t bring phone holders to attach to the window, so our arms got a bit tired after a while. Show mapillary captured by me
Bus travel
Posted by ViriatoLusitano on 18 June 2022 in Portuguese (Português).
Last updated on 19 June 2022.

Introdução
Em Portugal os aglomerados populacionais tendem a estar dispersos e não concentrados num único centro urbano. Várias destas aglomerações situam-se a vários quilómetros do centro da freguesia, que é a menor divisão administrativa em Portugal, tornando-se assim muito difícil encontrar estes sítios se não tivermos o nome que os habitantes locais usam para se identificarem.
 https://i.imgur.com/SYExQ6O.jpg
Comparação entre centros populacionais. À esquerda um sítio com várias aglomerações satélites e à direita um sítio onde a população está concentrada. Fonte: Bing
O Instituto Nacional de Estatística (INE) têm uma base de dados contendo o nome e os limites geo-referenciados de diversos aglomerados urbanos. É útil ter esta informação no OpenStreetMap, pelo que este guia ajudar-te-á a como se deve proceder à sua inserção no OSM.

My name is Hopeful Bafamodei, a member of Unique Mappers NGO Nigeria. I joined Unique Mappers Nigeria in the year 2021 through our national coordinator Victor Sunday and have been active as a youth mapper in engaging in mapping programes. I partook in April citizen science land pollution lookout where i headed a team of 10 in the sprint in locating and mapping out oil polluted area in Niger Delta were we were all given certificate for participation. I have introduced a lot of people and signed them up in Open Street Map. On 4th may 2022, I attended unique mappers network monthly mapathon, map my village for social good, where i was taught as a beginner mapper on how to map. I was also coached by our national coordinator Victor Sunday on how to organize mapping projects in my local community. i am a Team Lead Unique Mappers, Bayelsa State chapter and we are currently planning on hosting a state wide mapathon in Bayelsa state Nigeria. on the 15th of June 2022 i featured in a volunteer mappers orientation organized by Unique Mappers Team Port Harcourt Nigeria (youth mappers chapter), where i anchored a topic on mapping to respond to female genital mutilation, domestic violence and gender issues. i also attended June mapathon hosted by open mapping hub eastern and southern Africa on the 16th of June 2022. in this webinar i learnt some key things, one of it is to identify, recognize, nurture and collaborate with key institutions, groups, and individuals working in OSM. i also learnt how to promote effective use of OSM data and connect it to everyday lives of people: bring data, technology and people together.
Iran
Posted by dcapillae on 18 June 2022 in Spanish (Español).
Last updated on 8 June 2026.

 Estación de recarga para vehículos eléctricos en la avenida Pintor Joaquín Sorolla. Fuente: trabajo propio (CC BY-SA 4.0) disponible en Wikimedia Commons.
Las estaciones de recarga para vehículos eléctricos gestionadas por la empresa privada Iberdrola en el municipio de Málaga ya aparecen en OpenStreetMap. Se han añadido al mapa un total de 22 estaciones de este tipo a partir de datos abiertos del Ayuntamiento.
Estas estaciones corresponden con los puntos de recarga recientemente instalados por Iberdrola, fruto de una concesión de explotación que le concedió el Ayuntamiento por un total de cinco años, prorrogables otros cinco. La empresa adquirió el compromiso de instalar puntos de recarga en los once distritos municipales.


A few days ago a few mappers in the UK noted that Bing imagery seemed somewhat out-of-date. I noticed it because it appeared not to show recent housing developments until zoomed in at z20. I found a development just outside the village of Llanbedr Dyffryn Clwyd whilst mapping rooftop solar in Denbighshire. My workflow for solar mapping uses Josm. As all the new houses had solar panels I wanted to add the buildings themselves, and I find the way in which imagery can be aligned easier to use in iD than in Josm (particularly as the offset needs cancelling in Josm which does not fit task-based mapping over several thousand square kilometres). So I did it a little crudely in Josm, only to discover that at z20 the imagery was available in iD, so I tidied things up a bit.
I didn’t think much about it until a local mapper in the area commented that Bing seemed a bit behind. This seemed a bit more significant, so I looked at my local university campus which is under continual development and therefore has lots of features which enable one to age imagery. To my consternation the zoom levels down to z19 showed a building which was demolished at least 7 years ago. Whilst looking at this area just now, the z20 imagery appears to be disappearing from cache.
A short distance South of the University is the Nottingham tram line which was well under construction in 2013 because a major bridge was put in place in September of that year. The ‘updated’ Bing imagery now pre-dates the tram development, and any construction work on the Chinese Studies building which opened in January 2013. It does show a new lecture theatre on the main campus which was built post-2009. It therefore appears that the imagery has reverted to a state around 2011 or 2012. Co-incidentally or not, this seems to be the same as ESRI Clarity.
I’ve looked at a couple of other places where I know construction work bridges this period:
Posted by F-5 System on 17 June 2022 in Russian (Русский).
Last updated on 18 June 2022.
Лонг рид, в том числе чтобы самому разобраться )
Захотелось мне помапить деревню Чанчур в верховьях реки Лены (ну с кем не бывает). И в одной из статей о ней прочёл, что у истока реки Лены поставили часовню. Стало интересно, замапил ли её уже кто-нибудь? Полез я в верховья реки Лены, и тут началось..
Википедия говорит нам, что исток реки Лена тут 53°56′00″ с. ш. 108°05′02″ в. д.. Но если мы пойдём ниже по течению, то увидим, что эта река “Лена” впадает в реку “Лена” (возможно на момент прочтения уже поправлено). Хм.. Обратимся к источнику гидрологических знаний и увидим, что есть два “водных потока” река “Лена” длинной 13 км и река “Лена (Большая Лена)” длинной 1726 км. Это же видно и по ген.штабу. Измерив русло от истока каждой из них до точки их слияния с помощью OsmAnd получим “Лена” - 15км, “Большая Лена” - 19км.
Лирическое отсупление: почему-то у реки Большая Лена “длинна водотока” указана 1726 км, при этом впадать реки начинают за 4279км от устья, а в Википедии общая длинна указана вообще 4400км.