 OpenStreetMap
Diary Entries in English
Recent diary entries

I am currently planning to rewrite the Relation template for the OpenStreetMap-Wiki. You can find the current version along with its documentation in the wiki. In the following text I would like to outline the objections behind my proposed rewrite and invite you to participate.
Purpose of the template
- common appearance and functionality (general goal of templates)
- maintainability as the wiki markup is just saved once, so if a tool is obsoleted, it can be removed from the template
- referring to relations in wiki articles
- creating links to tools automatically
- often used to document the mapping status of relations in wikitables
Reasons for a rewrite
- This template is commonly used and causes many pages to exceed their page limits. You can see the effects of this on the bottom of the wiki page about Beijing buses.
- Some of the tools featured in the template are not accessible anymore.
- The default settings cause all tool links to appear, but this is often not desired by the editors.
- The template’s code is hard to maintain as it is currently written in wiki markup including parser functions, thus not allowing line breaks or additional white spaces.
My suggestion
- Rewriting this template using Lua, based on a forum discussion.
- Changing its defaults regarding the appearance of tool links.
- Dropping uncommonly used features.
A documentation of my proposed changes is located at osm.wiki/Module:Sandbox/Tigerfell/doc.
Please feel free to comment your suggestions here or into the forum thread already used.

Just thought I would re-iterate something imagico blogged about. Some important features may have disappeared from the map near you. You should check! Use the OSMInspector “Areas” view:
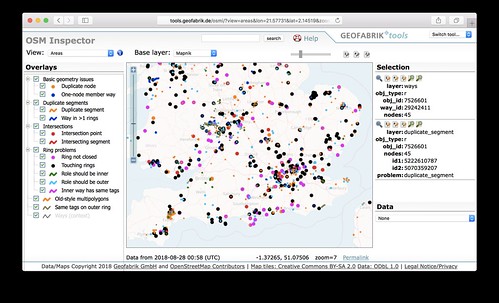
Generally the pink things are more serious data bugs on there I think, and they’re worth fixing because it could be a big building, or local park, or some other important feature which may have recently disappeared. This is due to a change in the renderer. It’s an improvement, but it means it is being more strict about these data bugs, so we need to fix them! (Yes we’re fixing for the renderer, but these were worth fixing before because other systems will always have struggled with this data)

I wanted to share how anyone can contribute to suspicious reasons in OSMCha. Recent events have only highlighted that we can tackle the problem of validation by working together and not by isolated efforts.
Wille is working on a new version of this process that would make it easier to flag features in OSMCha but I wanted to document this current way. When the new version lands in a few weeks time, I will document that process publicly too.
What do we need
- a geojson of a OSM feature with metadata tags
- a suspicious reason
- a OSMCHA production token
#### 1. Geojson of OSM Feature
At Mapbox, we use the standard geojson schema as per http://geojson.org/. This is the reason why, OSMCHA was created to expect a geojson as an input when we want to post a suspicious reason. Please see the example geojson feature below.
Example Geojson feature with suspicious reason added in properties

Proper mapping requires ‘‘en situ’’ observation of the POIs to be mapped. Ann and I accordingly took a break from our other duties to investigate the Argentina Pub, conveniently located about 10 minutes’ driving time from our house. Good pizza and salad (I was driving so alas could not partake of any nectar). It also offers steaks, which we will also investigate in due course. osm.org/way/621972265
That said we have broken 300,000 Mapillary images and 11,000 kilometers of imagery collection.
Last week I met the head of the Turkmen Motor Roads State Concern, and he confirmed my list of national highways was nearly complete (one highway was missing, which he provided but which still lacks a route number; I have added it to the list in the wiki). My next “armchair” project when duties preclude getting out on the road will be to identify the national highways with appropriate tags. If Turkmenistan is to become a transportation hub for Central Asia, it will need a decent online road atlas. OSM is currently the best map of the country available to the general public.

I used to download “True Colour Imageries” (TCI) through the S3 bucket. It’s simple and easy, via a web browser too.
All it takes is go over here, for example; focus on an area of interest. To download a particular scene, a URL to the S3 bucket will be provided. Bob’s your uncle!
Since I don’t have an always-on (and unlimited) connection, one single file (TCI only) is ~150MB tops. That shall be sufficient for a quick and rough edit.
Recently I’ve learned that the access to the L1C S3 bucket is put behind a paywall. Sad news, for me, indeed.
The only alternative left is downloading through the Copernicus Open Access Hub (free signups). However, this means that I will need to download the whole scene (various spectrums) in a compressed archive: ~700MB zipped file. Which is (uh, ahem) a little bit excessive on my side. Well, well.
Last week I took two days to tour parts of southern Balkan Province in Turkmenistan, hitting the towns of Etrek, Esenguly, and Ekerem, as well as the villages of Oboy and Daneata (the villages are now on the OSM map based on this ground truth). En route for the first time I filled a 32 Gb memory card with Mapillary imagery and had to install a backup SD card in the Samsung Galaxy smartphone I use for collecting ground-level imagery. Those images are being uploaded now. It may take a few days, since the internet here is so slow.
It will take a while to enter all the edits from data collected on this trip. Much of the M37 is now four-lane dual carriageway (divided highway) so I need to add all the U-turns I marked on the Garmin GPS as well as lots of POIs.
The route took me within a stone’s throw of the border with Iran, but we only saw a few Iranian tractor-semitrailer rigs on the roads. Road conditions between Etrek and Ekerem were rough to very rough, with speed averaging 25 to 30 mph (40 to 50 kph). GPS traces have been uploaded from the Garmin nuvi, Pocket Earth, and Mapillary gpx file.
We discovered two new gas stations and confirmed a suspected third one. In Ekerem (formerly called Okarem, but the signs we saw are clearly labeled Ekerem) we lunched on Turkmen meat-filled somsas that cost 2 manat (about 57 cents) apiece from the only cafe in town while tailgating on the beach.

Dear Diary, I utilized my experience ability in mapping by training some persons on how to map on osm, and Guess WHAT? It was AWESOME!!!

We released Vespucci version 11.0 at the beginning of July, 2 months later, the first beta of 11.1 is now available on googles play store and from our github repository..
Before going in to some details on 11.1, a quick word on the plans for the rest of the year. I hope that we can limit the testing period of 11.1 to the month of September and release early October.
My current plan is that 11.2 will have no new features and will solely be a vehicle to deal with googles forced update policy (see https://github.com/MarcusWolschon/osmeditor4android/issues/773 too). This also implies that there will be no update/bug fix releases of 11.1 after November 1st, so get on with testing :-) and that the google play version of the app is very unlikely to support pre-Android 4.0 devices any more.
Version 12, if all goes well including some interesting UI changes, will become available early 2019 in time for Vespuccis 10th anniversary. Back to 11.1.
Improved preset handling
The internal representation of presets has been overhauled allowing us to implement some new features without adding to already very byzantine code. The major changes for users are:
- Tri-state checkboxes: this is similar to how JOSM handle checkboxes in the preset display. Preset check fields that can have an explicit “no” or “off” value, start off in an indeterminate state and then can be toggled to on and off. A long press will return the checkbox to the indeterminate state. Previously such check fields were represented by a “radio button” like UI. Check fields that do not set an off value continue to work as is.
- Support for checkgroups. Checkgroups are groups of checkboxes, these can have a label and are handled very similar to multi-select fields, in most cases you will not even see a difference. The change allows a much more compact layout for presets that have many checkboxes, for example the payment methods preset. And caters for a general trend to tagging in such a style.

Re: https://www.bbc.co.uk/news/technology-45354311
I regret to announce that a now-reverted changeset on OpenStreetMap may have caused the issue. This poses serious questions about the protection of OpenStreetMap data from malicious edits like these, particularly when political discourse is at record levels of toxicity.
Last week, I went outside and walk around our neighborhood to do the assignment that was given to us by our instructor which is mapping our neighborhood. I thought it will be easy since it is around my neighborhood and all I have to do is to add buildings and put a tag such as sari-sari store, school supplies, etc., but it wasn’t. I think as a beginner, it was really hard because I have to count all the houses on every street to be able to make it right and accurate though I know mine was not that accurate at all. I added names on the streets which are not on the map and also putted some pathways which are technically shortcuts. I also did wrote some of the house numbers and one of our basketball court which is not on the map. When I was halfway on mapping, I just realized something. I realized that it’s been a while since I went on a walk along our neighborhood. I remembered some of my childhood friends which I was playing with when I was still little. I remembered the games we played, all the laugh that we shared and all the fights that I went through haha. Well I guess this assignment made me feel nostalgic and was fun :)
ang napili kong magandang feature area para sakin ay yung aming basketball covered court, dahil dito ako madalas pumunta at hilig ko kasi mag laro ng basketball kaya ako lage nandito. dito ko rin kasi natutunan maging palakaibigan,rumespeto,makisama, dito rin ako nakaranas ng iba’t ibang karanasan na nangyare saken, mapaaway makigulo pero kahet ganun lahat ng yun naging part yun ng kasiyahan saken.kaya paraq saken ito ang magandang lugar para saken marami pang mas magandang lugar pero kahet gaano kaganda sila para saken itong basketball covered court ang da best saken kasi dito ako maraming magandang memory na nangyare saken at kasiyahan. kaya kung may magtatanong saken kung ano pinaka magandang lugar para saken ito ang sasabihin ko sa kanila. di ako magdadalawang isip na sabihin ito. dahil ito ang aking pinag mamalaki at wala akong paki kung pag tawanan man nila ako kasi dito ako masaya ito ang aking gusto,

Mapping during my CWTS time is such a good thing to do. We are able to contribute to society by mapping of “unseen” surroundings and areas that look inaccurate. The community benefits from this open source map that we can use on any means for information. Mapping for me has become a service and makes me happy when I map. (and even if some of my edits won’t register) I’d like to discover more things about Mapping and how else I can reach out to the community.

Version 2.11.0 of the iD editor now has the ability to display vector tiles as overlays. With help from a bunch of people I was able to create and display a vector tile overlay for use in iD. I want to pass along what I learned to help others.
Creating Vector Tiles
So you have some data you would like to display in iD to help editing. I used Florida State Trails data which is open data on the Florida State open data site. The licensing is suitable for OSM. Once you download the data, I recommend reviewing the data using QGIS to see what it look like. QGIS shows all of the data visually. Adding an OSM baselayer helps understand how the data would fits with OSM. QGIS will also convert the data to a GeoJSON needed for the next step, which is coverting the GeoJSON to a Mapbox mbtiles files. Lets look at the steps in more detail.
- Download the data and open in QGIS.
- Convert to a GeoJSON. If the data looks good in QGIS, save a copy as a GeoJSON using the Save As in the Layer menu option. If the data isn’t in WGS84 (EPSG:4326) projection QGIS will allow you to change the projection for your new file.
- Use Tippecanoe to convert the GeoJSON to an mbtiles file
tippecanoe -o yourdata.mbtiles yourdata.geojson
Serve the data as a Vector Tile
The data is now ready for a Vector Tile Server. I used Mapbox’s Studio to load and serve the data.
-
When i mapped my neighborhood in Barangay Bagong Silang Mandaluyong CIty, i discovered that i really am a tourist in the place that i live in. I have stayed here for only two years now. I use to lived in another barangay in Mandaluyong City but due to educational situations i was forced to live in my fathers condo unit. I realized that i never really wandered the neighboring places within my home. I never really go outside because its exhausting and all the establishments i needed was already down stairs. I also believed that the neighborhood is unsafe since there was incident where a person was shot dead.
In exploring and mapping my neighborhood, i realized that i am surrounded by 3 barangay halls. First is the Barangay hall of Bagong silang, the second one is the Baranggay hall of Hagdan Bato and lastly the Barangay hall of Daang Bakal. I also noticed that there are lots of canteens behind our building. The street was filled with canteens that varies in low prices and as of what I’ve heard these canteens are budget friendly and quality wise specially to students. There are also mini stores that sells food, shakes, burgers and etc. There is also a mini market within those streets. I have also discovered a lot of shortcuts but it is only used with foot paths.
I am quite surprised by the places that i have discovered in my neighborhood. I wished i could’ve discovered it sooner since knowing these places could’ve been such a big help to save my expenses in food. Also knowing that there 3 barangay halls that surrounds me could’ve helped me more in my previous researches. I am now motivated to go outside, gain some weight and explore more of what my neighborhood can offer but i will also look out for my safety as always.
pupsjcwts

Abstract
Codici di Avviamento Postale (postcodes) are propriety of Poste Italiane S.p.A. Sometimes OSM mappers who love the completeness of data cannot get this codes from open sources.
The below procedure is a simple workaround, taking advantage of iPA (Public Administration index) OpenData which lists widespread public offices in Italy.
Getting data
Go to iPA site and download “Amministrazioni” file. Here you can read when it was last updated.
Filtering data
On downloaded file, run:
$> awk –field-separator=”\t” ‘{ print $3”,”$6 }’ amministrazioni.txt | sort -u > CAP.csv
The command above takes TAB-separated columns 3 and 6 (municipality and postcode), sorting uniques and writes a comma-separated file.
Alternatively, you can switch columns for postcode sorting:
$> awk –field-separator=”\t” ‘{ print $6”,”$3 }’ amministrazioni.txt | sort -u > CAP.csv
Multi postcode municipalities:
Some cities have more than one postcode: it could be someway useful listing public office addresses (column 10) to approximately identify the area:
$> awk –field-separator=”\t” ‘{ print $3”,”$6”,”$10 }’ amministrazioni.txt | sort -u > CAP.csv
Take a look
To count extracted postcodes, simply:
$> wc -l CAP.csv
8638 cap.csv
For an overview of firsts and lasts codes:
$> head -3 CAP.csv && echo “…” && tail -3 CAP.csv
Abano Terme,35031
Abbadia Cerreto,26834
Abbadia Lariana,23821
…
Zumpano,87040
Zungoli,83030
Zungri,89867
Download
Please, find in CSVs repo processed files.

First part was about why dense (well mapped) areas should be treated better than outdoor/rural areas. Today I will discuss rendering objects according to their size.
There are many types of maps and one of the most important property is their preferred use. OSM Carto has no special goals of this kind, it is meant to be general style. Unfortunately, it’s harder to develop because of this.
Putting all the things on the map according to their “importance” is misleading, because without clear goal it’s hard to tell what system should we apply to show some items more prominently than the others. In practice it seems that people tend to think mostly like “I want to find x” or “it was always like this”. But finding is better done by apps and we show many object types, so sticking to the old solutions will just highlight lack of clear rules eventually.
So - what could be the universal property of objects that we could use on the map? I think this is their size.
In a matter of fact, it is used a lot already. We use initial zoom levels to not show benches at the world level, because then the map would look more or less like this:

Thematic Maps
- https://sunders.uber.space (Surveillance under Surveillance)
- https://farmshops.eu
- https://opencampingmap.org
- http://www.openbusmap.org
- https://www.openrailwaymap.org/
- https://defikarte.ch/ CH-only
- https://osmlanduse.org
- Constructionsite worldwide
Cycling
Placenames
Others
For people with limited mobility
- Find Wheelchair accesable Places
- Routing for Wheelchairs
- namo DE-only
- OpenSidewalks Some US-Cities
- Access map Seattle-only
Fun OSM-Projects
- https://makemydrivefun.com/
- https://omnesviae.org/ (Roman Routeplanner)
- https://mourner.github.io/road-orientation-map (Streetorientation)
- https://geoffboeing.com/2019/09/urban-street-network-orientation/
- https://kinderkiez.net/ (Carpent for Children)
- https://backofyourhand.com/ (Game of Streetnames)
- https://hanshack.com/figuregrounder/ (Create a Poster)
- http://hanshack.com/sorted-cities/tool/index.html (Sorting Buildings) broken
Live OSM-Edits
Compare Maps
Generate Map
- https://maposmatic.osm-baustelle.de (Generate Citymap)
- http://fieldpapers.org/