 OpenStreetMap

On a silver post on the NE corner of Hwy 64 and 285
Diary Entries in English
Recent diary entries

Life in a multi-million population City can be tough on Introverted minds. For me, mapping in OpenStreetMap is first and foremost an activity to improve publicly accessible geodata around my local and known places, though it has also recently become a way for me to virtually travel to far away places. Exploring remote corners of the earth that are not quite as bustling with activity, where not every square-meter has already been meticulously mapped to the nth degree. Theres even a subreddit for this kind of exploration: /r/GoogleEarthFinds !
Zooming in on a random patch of rainforest, a tiny island in the pacific or one of the thousands of meandering arms off the Amazonas shows a mostly untouched view of nature. Panning around looking for interesting landmarks, it only takes a few minutes to stumble upon a secluded village whose roads are not even connected to the world-wide network, or a lonely farm in the middle of nowhere. These are the places that fascinate me the most. I get lost in imagining what life is like there, who lives there, what untold stories do these places hold? While daydreaming of this, i map the buildings I see, paths and roads, things that can safely be confirmed from aerial imagery. Switching to different imagery providers can show how these places evolved, has the village grown or shrunk? Have Roads been extended or left to be reclaimed by mother nature? A handy website for viewing satellite imagery with different timestamps is https://livingatlas.arcgis.com/wayback
Usually I just zoom into random places and see where it takes me. With the power of Overpass Turbo, one can find places in a slightly organized fashion. Below is a prompt which shows islands that have residential areas on them, within the current view of the map:
[out:json][timeout:25];
(
nwr["place"="island"]({{bbox}});
  );

nwr["landuse"="residential"]({{bbox}});

// print results
out geom;
Or simply highlighting villages in the current map view:
August 2–8
August 2
- Fixed Reynoldsburg borders; borders now up-to-date as of most recent annexation on May 24, 2026.
- Updated Reynoldsburg population; increased to 43,350 according to U.S. Census Bureau.
- Added intermittent stream called Little Jordan Run.
- Modified Jackson Avenue; changed “one way” value to “no” and added note that signage by the Street Department is incorrect. Correct name is Jackson Avenue not Jackson Street.
- Modifed Burkey Avenue; changed “one way” value to “no” and added note that signage by the Street Department is incorrect. Correct name is Burkey Avenue, not Burkey Drive.
- Modified Burkey Court; switches from Burkey Avenue to Burkey Court at the intersection with Southwood Avenue, not in the middle of the road.
- Fixed name of Taylor Park Drive (originally shown as just “Taylor Park”).
- Fixed differentiation between Taylor Road and Taylor Road Southwest.
- Added info to Raider Stadium (Reynoldsburg High School football stadium).
- Removed Smokey Bones brand from building at 2200 Baltimore-Reynoldsburg Road (closed permanently after bankruptcy).
- Added info to Reynoldsburg High School’s Livingston Campus.
August 3
- Fixed name of Taylor Road.
- Added 5 ponds near Lakeland Hills neighborhood.
August 5
- Added name of TS Tech Drive as indicated by street signs in the area.
- Added name to the remaining portion of Wilma Drive.
August 9–15
August 9
- Removed nonexistent Truro Township enclave inside Reynoldsburg around Blacklick Creek.

To-do: Add bus route 42 stops through Highton and Belmont. Will be referring to McHarry’s route map and ensuring match with Transport Victoria resources.

I am currently focusing my mapping work on the Taiping Heritage Zone. Most of the shoplot footprints and major buildings have been completed, and I am now working on detailed micromapping for schools, museums, and government buildings.
Please feel free to contribute by adding any missing information, such as shop or stall names, building levels, address numbers, or other relevant details that I may have missed.
Let’s work together to make Taiping one of the most complete and detailed small-town maps in Malaysia on OpenStreetMap.

As explained in this french diary entry I left a bunch of notes, took a bunch of traces while visiting Mongolia in July. The main reason, was that I was playing with StreetComplete and firing Vespucci would have annoyed my wife adding notes was easier. So I left notes, for later. Today I decided to start editing based on my memory and some of the notes. While editing, I saw a very high number of these in the center of UB.
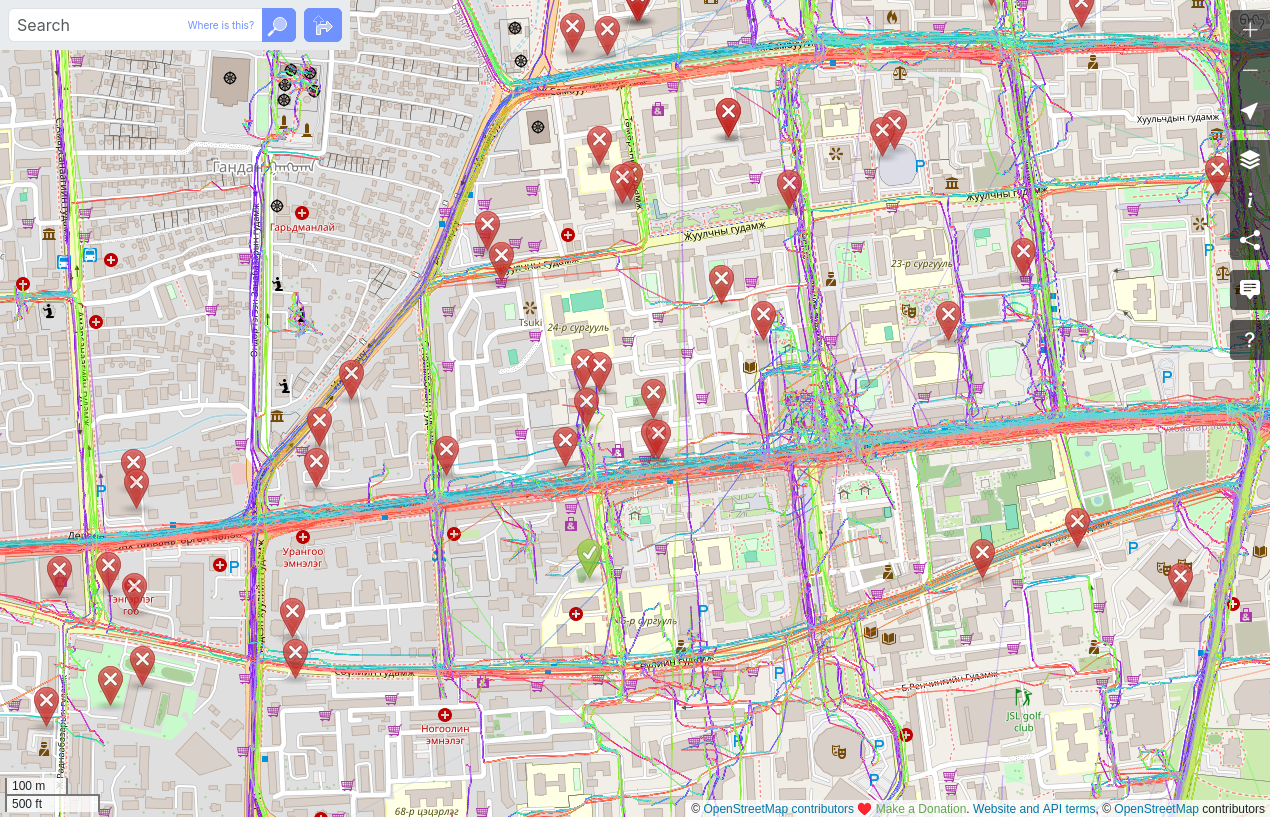
Many are old, and the imagery is old. Is there a process to clean up notes? Are there people willing to spend time taking these notes and making the edits that for some are probably needed?

Upgraded from the Max to the Max2. Going to publish my settings here so it’s easier for me to find.
Walking
- Same settings as Bicycle Settings below, except set the Interval to 1 or 2 seconds depending on walking speed. 2 if casually walking, 1 if brisk.
- Very important: Use a selfie stick and hold camera at least 6 inches above head to capture better images. The higher the better.
Bicycle, My main method of capturing imagery. Most tested.
- Time Lapse 360 Video
- Resolution 8K
- Interval 0.5 Seconds
- Bit Depth 10-Bit
- EV Comp 0
- ISO Min 100
- ISO Max 800
- Color Natural
- Sharpness Low
- Denoise Low
- Bit Rate Max
Car
Still need to test and figure out the settings. I currently use a dash cam for a car and I don’t have an exterior mount for my GoPro. Dash cam I use is an AZDOME GS63H. Very simple to use and great quality images. And one of the few dash cams that work with Mapillary for less than $100. I got mine on Ebay for about $50.
According to the Alaska Department of Fish and Game, there are over three million lakes in Alaska with a surface area larger than five acres!
Currently, in OpenStreetMap, there are roughly two hundred and forty two thousand elements in Alaska tagged with natural=water, which is a generic tag for an area filled with water.
So, I have decided to embark on mapping natural areas filled with water!
I use the USGS elevation data for alignment, as it seems to have the best alignment to where things actually are on the ground. The USGS imagery is sometimes aligned with the elevation data, but sometimes is not, so the Mapbox and ESRI Clarity imagery is instrumental in areas where it is more accurate to the elevation data.
The National Map Topographic is extremely useful for some lakes, for those where it matches the elevation data well. Often though, it does not match the elevation data.
I posted about this in the OpenStreetMap Slack, and have received help from Watmildon, who has been very kind and extremely helpful! He is helping with the technical aspects of this, and has brought the 3DHP program to my attention, a hydrology program from USGS that is based on elevation data and thus much more accurate than the older NHP data. He is helping to setup a website where one can view the differences between OpenStreetMap, NHP, and the 3DHP, and eventually I hope to be able to overlay the 3DHP data onto an OpenStreetMap editor so I can use it to assist the mapping.
Thanks for reading and happy mapping!
Sources:
https://www.adfg.alaska.gov/index.cfm?adfg=rivers.main
https://taginfo.geofabrik.de/north-america:us:alaska/search?q=natural%3Dwater

One day, in a certain neighborhood, there was a heated discussion about naming an unnamed road.
At first, the discussion was about deciding what name they should choose for the road.
But can you guess the final consensus of that discussion?
They preferred not to be mapped.
The status quo was good enough, they said. The road looked like a maze, with little or no clue on how to properly navigate it. They argued that if they named the unnamed road, it would give “outsiders” a clue on how to navigate it, which was “bad” for the internal security of the people who lived there.
This made me think about the ethical grounds of conducting large-scale mapathon campaigns remotely.
We generally work under the assumption that “the more mapped places, the better.” But what if the locals don’t consent to being mapped?
What if they prefer not to be mapped?

Querying OpenStreetMap Data with the Overpass Turbo Wizard
If you’re new to OpenStreetMap (OSM), writing Overpass queries from scratch can seem intimidating. Fortunately, Overpass Turbo provides a built-in Wizard that generates queries automatically based on simple search phrases. This makes it easy to retrieve geographic data without learning the full Overpass Query Language (Overpass QL).
What is the Overpass Turbo Wizard?
The Wizard is a feature in Overpass Turbo that converts plain-language search terms into valid Overpass queries. Instead of manually writing code, you can describe the data you want and let the Wizard generate the query for you.
For example, if you want to find schools in the current map area, you can simply enter:
text
amenity=school
The Wizard will create the corresponding Overpass query automatically.
How to Use the Wizard
- Open Overpass Turbo.
- Zoom the map to your area of interest.
- Click Wizard in the toolbar.
- Enter a search expression such as:
amenity=hospital
or
shop=supermarket
- Click Build and Run Query.
- The matching features will appear on the map.
The generated query can also be viewed and edited if needed.
Example
Suppose you want to locate restaurants in the visible map area. Enter:
amenity=restaurant
The Wizard generates an Overpass query and displays all matching restaurants from OpenStreetMap within the current map view.
Exporting the Results
After the query runs successfully, you can export the results for use in GIS software or other applications.
- Click Export.
-
Choose a format such as:
- GeoJSON for web mapping and GIS tools.
- KML for Google Earth.
- GPX for GPS applications.
- Raw OSM Data for OpenStreetMap-based workflows.
- Save the file to your computer.
GeoJSON is the most commonly used format because it works well with tools like QGIS, Leaflet, and Mapbox.
Conclusion
I miss you

Pola Keyword SEO Spam Judi Online di Indonesia
Hasil pengamatan menunjukkan bahwa changeset SEO spam judi online di OpenStreetMap memiliki pola yang relatif konsisten. Brand umumnya menggunakan akhiran “88”, sedangkan komentar changeset berisi kumpulan kata kunci promosi yang diulang untuk kepentingan optimasi mesin pencari (SEO), bukan untuk mendeskripsikan perubahan data OpenStreetMap.
Observations indicate that SEO spam changesets related to online gambling in OpenStreetMap follow a relatively consistent pattern. Brand names commonly use the “88” suffix, while changeset comments consist of collections of promotional keywords repeated for search engine optimization (SEO) purposes rather than describing the actual OpenStreetMap data edits.
Keywords are ordered by descending frequency
Very High / Dominant Frequency
–88 (brand suffix)
slot
gacor
judi
casino
terpercaya
terbaik
High Frequency
login
daftar
link alternatif
RTP
maxwin
jackpot
bonus
deposit
withdraw
mahjong
zeus
Pragmatic Play
PG Soft
togel
toto
–77 (suffix)
–99 (suffix)
–138 (suffix)
–168 (suffix)
–188 (suffix)
–303 (suffix)
–777 (suffix)
Moderate Frequency
pola
cashback
free spin
scatter
wild
multiplier
cuan
menang
sabung ayam
SV388
poker
domino
QQ
Habanero
Joker
Spadegaming
Microgaming
Playtech
Unique Study: Trojan Horse Spam
Pada teknik ini, komentar changeset tampak sepenuhnya normal dan tidak mengandung kata kunci yang berkaitan dengan perjudian. Sebaliknya, konten spam disembunyikan di dalam tag objek OSM, sehingga deteksi yang hanya mengandalkan kata kunci pada komentar changeset menjadi kurang efektif.
In this technique, the changeset comment appears completely legitimate and contains no gambling-related keywords. Instead, the spam is concealed within the OSM object’s tags, making keyword-based changeset detection less effective.
Contoh / Example:

I’ve been mapping out every building I can that is visible from satellite imagery and Bing Streetside throughout Mount Pleasant. I’m currently focused on finishing up the neighborhoods and businesses that are on Chuck Dawley and Coleman Blvd, and I have almost finished filling in that large area made up from those major arteries.
I really wish I could use Charleston County’s GIS viewer for addresses and building shapes (especially for newer buildings, since people keep moving here ):< ), but of course the county puts all of their GIS data under copyright. That would be fine, but I tried contacting the GIS office to see if I could get permission to use their data, specifically their address data, but they never even responded. There are a few other ways that I could “request” address data but I don’t know if those requests would even be useful for mapping purposes. Best thing to do is to go to these neighborhoods myself and mark down any addresses that I couldn’t have gathered from Streetside. I’m not sure how I will do that without looking like a creep stopping at people’s houses and marking their address down. Guess I’ll have to grow a pair and do it anyway!
I do wish Bing Streetside had better image quality. The best images are from 8 years ago, and some houses have been demolished and replaced in that time according to Esri imagery (the most up to date imagery here, probably around only a year off). There are some spots with 2020 imagery but it just looks so awful. Even with the higher quality 2014 imagery you can barely make out small details like addresses at all. It really makes you appreciate what Google Street View provides, but we can’t use that at all. No wonder Bing Streetside completely shut down.
Posted by SomeoneElse on 27 July 2026 in English.
Last updated on 3 August 2026.
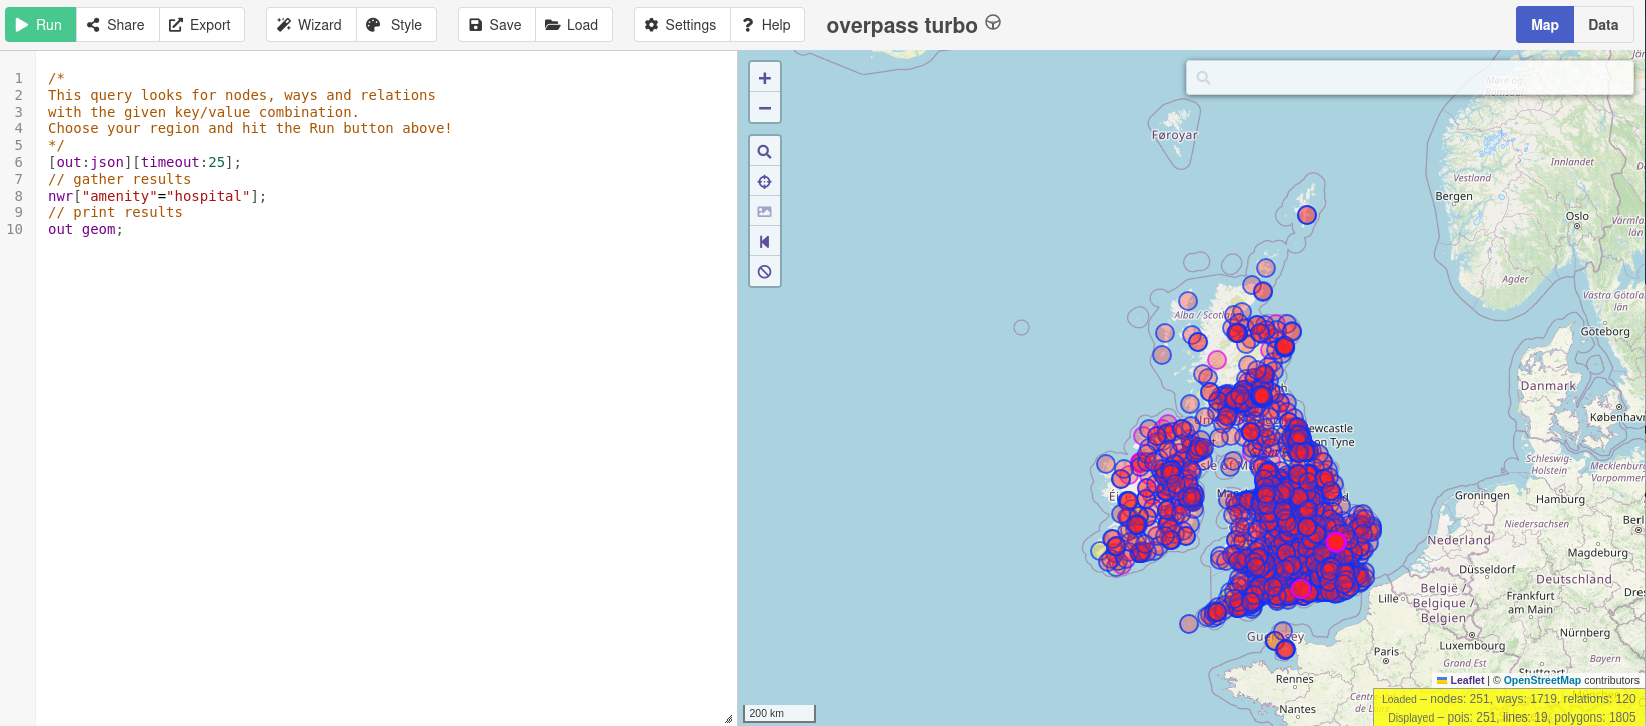
Note that this is an update of a previous diary entry. This version uses updated Overpass software from a fork.
Many people have noticed that publicly available Overpass servers have been suffering from overuse (a typical “tragedy of the commons”). OSM usage policies generally contain the line “OpenStreetMap (OSM) data is free for everyone to use. Our tile servers are not”. Unfortunately, there have been problems with overuse of the public Overpass servers, despite the usage policy. “Just blocking cloud providers” isn’t an option, because (see here - use the translate button below) lots of different sorts of IP addresses, including residential proxy addresses, are the problem.
Hi! For the last few years I’ve been building a service that exports OSM data into formats that live outside the GIS world: CorelDRAW (CDR), AutoCAD (DWG/DXF), SVG for illustrators, STL for 3D printing. It turns out the most grateful audience for OSM data isn’t cartographers at all: it’s signage designers who need a neighbourhood map as curves, civil engineers who need a DWG base plan, laser-engraving makers cutting city maps from DXF.
The main pain I had to solve was keeping LAYERS: roads, buildings and water should arrive in CorelDRAW as separate editable layers, not as one pile of curves. Every export is assembled from the same thematic groups OSM itself thinks in — roads, buildings, water, greenery, land use, POIs — and each group becomes a named layer of the target application: you can hide, recolour or delete it in one move instead of picking objects one by one. Street labels live on their own layer too — a signage designer usually wants them, a laser engraver almost never does.
The second pain is the boundary. A rectangle around a city inevitably drags in pieces of neighbouring areas, and cleaning them up by hand is painful. So exports can be clipped strictly to an administrative boundary: pick a city or district from the catalog (about 2.9 million admin areas across 179 countries) and every layer is trimmed to the outline, with cut polygons properly closed along the border.
The service: https://osm2cdr.com. All data © OpenStreetMap contributors, ODbL — attribution is embedded in every export. I’d love feedback from the community: what’s missing, and what feels un-OSM-ish?

I have been mapping on OpenStreetMap for a little over 11 months now. However, OpenStreetMap is not where my love for mapping started. 7 months beforehand, I started editing Google Maps. Every time I had a minute of free time, whether at my computer or on my phone while going to school, I would trace roads all around the world. I completely stopped doing anything else for fun other than fixing and creating roads.
However, this craze of mine ended on August 12th, 2025. I found out that more than 50% of my edits were being rejected by Google when I knew that all of them were OBJECTIVELY correct. I decided that I was done with Google Maps, but I needed something new to fill the hole that mapping had in my heart. That’s when I discovered OpenStreetMap 15 minutes later. I knew I had heard that name somewhere, so I decided to check it out.
Before I even completed the tutorial, I was hooked. While before I could only map walking paths, now I could map literally anything I want. Even the concept of mapping buildings was something I had to get adjusted to due to how small the number of things I could map on Google Maps was. I spent the rest of my day figuring out the mapping capabilities of the iD editor. The next day, I spent the entire day mapping and seeing what others had already mapped (spoiler alert: a lot).

In late-2025, we received a grant through NGI0 Commons Fund, a fund established by NLnet with financial support from the European Commission’s Next Generation Internet program to integrate vector tiles in uMap. This is a huge amount of work considering that a few non-trivial steps are required prior to be able to achieve that goal!
What “vector tiles support” means for uMap? At least, being able to render tiles on the Mapbox vector-tiles format (the de-facto standard), but, and that’s the interesting and hardest part, ideally to be able to customize those tiles: what if I can add a vector tiles style, but remove the buildings or change the road colors, to better fit the purpose of my map?
uMap used to be 100% coupled with Leaflet. In fact, it was initially designed as a storage for Leaflet — the first version of uMap was just a wrapper around Laflet.Storage plugin and django-leaflet-storage backend (well, the really first version was called django-chickpea, but that’s archaeology…).
So, our first need is to decouple from Leaflet, and clearly separate the rendering and the data. This is a work we have already started in the last two years but it was still unfinished (is a software ever finished is left as an exercise for the reader). Then, we want to take advantage of ES6 modules to only load the required JS files and speed up maps’ rendering (especially for read only access!). Finally, we currently rely on a lot of Leaflet plugins which are mostly either outdated and/or unmaintained that we need to port or adapt to the new chosen ecosystem.
Given that context, we are ahead of a long run BUT we already started at a good pace! Follow current PRs if you are curious. Now you may wonder why we choose OpenLayers as a target goal for vector tiles rendering over existing alternatives. Here are some of the reasons:
Posted by Venetis Charalampidis on 21 July 2026 in English.
A quick update on where things stand after the first half of the coding period.
In my first post I mentioned three goals for the summer. The first one, adding a Valhalla-powered routing endpoint that genuinely avoids closed roads, is now done.
What I built
The platform already had road closure data in the database. What it was missing was any connection between that data and actual routing. The frontend was calling valhalla1.openstreetmap.de directly, with no awareness of the closures sitting in our own database.
I set up a self-hosted Valhalla instance (3.5.1) running in the project’s Docker stack, loaded with Switzerland OSM data. Then I built a backend endpoint, POST /api/v1/routing/closure-aware, that sits in front of Valhalla and does the work the frontend couldn’t do on its own:
- Fetches currently-active closures from the database that affect the requested transport mode (car, bicycle, or pedestrian)
- Buffers each closure geometry into an avoidance polygon. LineStrings get a 10m buffer, Points get 15m, Polygons are used as-is. The buffering uses per-centroid UTM reprojection so the radii are true metres anywhere
- Sends those polygons to Valhalla as
exclude_polygonsso the route detours around them - Returns the trip along with a count of how many closures were excluded
The frontend routing page now calls this endpoint instead of Valhalla directly, so closure avoidance happens server-side automatically.
Coverage
The self-hosted Valhalla currently covers Switzerland only. For routes outside Switzerland the frontend falls back to the public Valhalla instance without closure avoidance, which is fine for now since the platform is Swiss-focused.
Next up is the sidecar service that feeds active closures into Valhalla’s traffic tile system, the second item from my original list. More on that soon.
The code is on GitHub if you want to follow along.

Please refer my March 2025 diary entry as this is changes only.
-
Changed the voice recording notes method to a dedicated microphone nearer my face. I launch a script at the same time I start the side cameras. It still saves as date/time stamped 1 minute length files.
-
Use a dedicated 2nd WiFi device on the laptop for direct connection (not using in van WAP) to the 225deg side facing camera. This increases the max framerate slightly. The 270deg side camera is still USB connected.
-
Procured a cheap 2K dashcam and mounted it rear window. Actually has a GPS position reporting fault, but the clock is okay. Do a lot of local processing to geotag against the UBLOX GPS unit to give 1FPS above 45kph and 3FPS below. Very handy for capturing the back side of speed signs by either swapping views locally or seeing the signs recognised on Mapillary.
-
The WiFi/cell router now has two antennas connected (MIMO) which helps the upload rate rate and low signal area performance. Now upload 15-40GBytes for each drive day.
-
One of the 20 year old Toshiba laptops had a temp sensor fail such that the cooling fans wouldn’t start. Upgraded both to 10 year old HP Probooks. These reduce processing time approx in half. The extra dashcam included. Still running Debian Linux.
-
No longer beacon APRS.
-
GPS nav unit now has giveway and stop sign POI’d displayed, so I can add these to the voice notes. I continue to create other special POI’s plus modify the mkgmap process for better end use.
Currently near Injune Qld about to sit still for a while.
Cheers Bob

I hate route relations. They make editing roads a nightmare, and they’re likely to be out of date. All people need is the list of stops, not the actual roads.