Diary Entries in English

Recent diary entries

Posted by FajrAl on 9 April 2026 in English.

A few days ago, I asked the community about converting general GIS polygons into OSM multipolygon relations. I’ve searched online but haven’t found a workflow that fits my needs. Specifically, I am looking for a way to handle three different levels of administrative boundaries where adjacent areas share a single boundary line connected via a relation.

My question on the OSM forum is still awaiting a solution: Link

However, someone from my local community mentioned that what I’m looking for is “topology.” While that is a broad GIS term, they clarified that TopoJSON is a specific format designed for this. There are many converters available to turn GeoJSON into TopoJSON.

Interestingly, I found that someone opened a ticket for a TopoJSON converter in JOSM back in 2020, but it hasn’t received a response yet: Link

Posted by FajrAl on 9 April 2026 in English.

I’m planning to update and expand the administrative boundaries for Bali in OSM. I’ve already prepared the multipolygons for admin_level 5, 6, and 7 using single shared ways for efficiency. By leveraging Google Sheets, I’ve also compiled a comprehensive list of Wikidata, Wikipedia links, and multilingual names to better serve Bali’s international profile.

However, the conflation process is proving to be a challenge. The existing data is quite a “nightmare” to clean up; many roads and waterways are currently shared with administrative relations, and landuse or natural features are glued to the boundaries. Time to start untangling!

Location: Bali, Lesser Sunda Islands, Indonesia
Posted by FajrAl on 8 April 2026 in English. Last updated on 4 May 2026.

Mapping administrative boundaries in Indonesia can tricky especially when dealing with overlapping names. Here is my simplified workflow for preparing this data:

1. Data Sourcing

First, download the official spatial data from Peta Rupa Bumi by Badan Informasi Geospasial or searching it in Satu Data Indonesia. This serves as the primary geometry source.

2. Extracting Place Nodes

Since the source data is in polygon format, I use QGIS to extract the centroids (points). These points are essential for creating the place=* tags that represent the center of each administrative area.

3. The Importance of Kemendagri Codes

The polygons include Kemendagri reference codes. These are vital for:

  • Conflation: Ensuring data matches across different sets.

  • Identification: Many villages (admin_level 7 or 8) share the same name. The code helps distinguish them within a Regency or Province.

4. Enriching Metadata

Using spreadsheet tools and conflation techniques, I cross-reference the data to add:

  • Postal codes

  • Wikidata and Wikipedia tags.

  • Multilingual names (name:en, etc.).

5. Geometry Processing

To follow OSM best practices, I convert the polygons into independent ways (polylines).

  • This allows adjacent areas to share a single boundary line via a multipolygon relation.

  • Once converted, I export the result as a .geojson file.

6. Final Tagging

Finally, I use the previously extracted place nodes to quickly copy and paste the relevant tags into the new multipolygon relations in my OSM editor.

Location: -6.175, 106.827
Posted by greamarchitects on 7 April 2026 in English.

🗺️ Entry 1 — Setting up JOSM & Plugins

Mapping Banjë, Albania

I started mapping the Banjë region in Albania by setting up my editing environment in JOSM.

⚙️ Setup

I configured JOSM with a set of plugins to support structured mapping and validation:

  • utilsplugin2 – general productivity tools
  • reltoolbox – relation and multipolygon editing
  • waydownloader – working with connected geometries
  • merge-overlap – cleaning overlapping features
  • Relation Validation Plugin – checking data consistency
  • FastDraw – faster geometry digitizing

I also explored additional plugins like contour-related tools for terrain-based mapping.

🗺️ Mapping Context

The focus area is Banjë (central Albania) — a landscape with: - Complex terrain (valleys, rivers, slopes)
- Mixed land use (forests, agriculture, settlements)
- Incomplete or inconsistent OSM coverage

🌱 Initial Observations

  • Landuse classification is often fragmented or overlapping
  • Boundaries between forest, farmland, and settlements are not always clear
  • Many features require clean multipolygon structures
  • Validation tools already highlight conflicts in relations

🎯 Next Steps

  • Clean and structure landuse polygons (forest, farmland, residential)
  • Resolve relation conflicts and validation errors
  • Improve consistency of tagging using presets
  • Start refining settlement structures and road connectivity
Location: Shinavlash, Tregan, Elbasan Municipality, Elbasan County, Central Albania, 3026, Albania
Posted by rphyrin on 6 April 2026 in English. Last updated on 11 April 2026.

So, I’ve been using Altilunium LocationPad for several of my personal projects until now. But recently, I encountered several problems.

I dabble with multiple projects at once, but this app saves everything in a single database. I want this app to be able to create several separate “canvases”, so I can manage several of my projects at once, without mixing them with other projects.

See full entry

Posted by SirfHaru on 5 April 2026 in English.

I was recently reading Demographic deposit, dividend and debt by Sonalde Desai. Following the Standard Operating Procedure, I looked up this Sonalde person and turns out she is a researcher at a research institute in Delhi called National Council of Applied Economic Research. The work of this organization felt interesting to me, so I had to pause my studies and see its location on OpenStreetMap.

Nothing. Looks like the place hasn’t been mapped yet. I searched for 11, Indraprastha Estate since that was mentioned on their contact page and this time I did find an object. A person called “n’garh” had added the address back in July 2014 and I am so glad that I was quickly able to push a changeset (#180878526). Another win for address mapping!

This post was first released on my website with 💜 under CC BY-NC-SA 4.0.

Location: Indraprastha Estate, Kotwali Tehsil, Central Delhi, Delhi, India
Posted by Zkir on 4 April 2026 in English.

Hey everyone,

the new version of UrbanEye3D, namely 2.0.0, is out!

This is a major update for the plugin. It’s been a lot of work and took about 2.5 months, but I’m confident it makes the 3D view significantly more useful and enjoyable to work with.

For those who haven’t heard of UrbanEye3D before: it’s a JOSM plugin that renders a 3D world from OpenStreetMap data directly inside JOSM. This lets you preview objects in 3D before uploading your changes to the OSM database.

What’s New

1. 2D Ground Plane

Buildings no longer float. The ground surface is displayed with “flat” objects - roads, lawns, rivers, and lakes. This flat layer is rendered based on downloaded OSM data using a custom MapCSS style. Alternatively, a satellite background can be enabled, as before.

image

2. Trees

See full entry

Strado – Neighborhood Livability Scores from OpenStreetMap

I’ve been working on Strado, a free tool that scores every neighborhood across 50 European cities using data from OpenStreetMap. I wanted to share the project with the OSM community since it’s built entirely on your work.

What it does

Strado analyzes 22 categories of POIs from OSM – restaurants, healthcare, transit stops, parks, schools, nightlife, grocery stores, and more – and computes livability scores at the street level using an H3 hexagonal grid (resolution 9, ~174m edges).

The idea is simple: if you’re moving to a new city, you should be able to compare neighborhoods by what’s actually within walking distance. Not opinions, not sponsored listings – just data.

How it works

  1. I imported the full Europe PBF into PostgreSQL/PostGIS using osm2pgsql with a custom flex style
  2. POIs are extracted across 22 categories based on OSM tags (amenity, shop, leisure, healthcare, etc.)
  3. Each H3 hex cell gets a count of nearby POIs with k=1 neighbor expansion
  4. Livability scores are computed from essential categories (grocery, healthcare, transit, parks, education, safety)
  5. Activity scores come from lifestyle categories (dining, nightlife, cafes, culture, shopping)
  6. Everything is served as PMTiles vector tiles from Cloudflare R2 – no backend server needed

The scoring engine runs client-side in the browser using MapLibre GL JS. The entire infrastructure costs $0/month.

The data

  • ~78 million POIs from OpenStreetMap
  • 50 cities from London to Athens
  • 22 scoring categories
  • 20.5 million hex cells scored

Try it

  • Interactive map – click any hexagon to see the score breakdown
  • City pages – browse all 50 cities with neighborhood rankings
  • Rome example – top neighborhoods, category breakdown, FAQ

All data is attributed to OpenStreetMap contributors under ODbL. Every page includes the attribution.

What I learned about OSM data quality

See full entry

Location: Castro Pretorio, Municipio Roma I, Rome, Roma Capitale, Lazio, Italy

As reported on the Irish OpenStreetMap website, we recently “finished” mapping all the buildings in Co. Down. Due to my goal to get high up in the UK statistics (I made it to #1), I apparently mapped 3,283 tasks, if I’m reading the statistics right. Thanks to the grid system, that led to a fairly systematic coverage under my watchful eyes, resulting in the spotting of 13 potential unrecorded archaeological sites. It took me until today to write the reports to the department in Northern Ireland, because it’s not as much fun as mapping.

Link to overpass-turbo query

I usually add a note=might be a something site, discovered by b-unicycling YYYY-MM-DD to the way, so that I can look for them in overpass-turbo, once I get around to writing the reports to the respective government department. I then add reported by b-unicycling YYYY-MM-DD or something along the lines to the note, so that I know I have reported that one already. This is really only to help me keeping track of what I have discovered and what I have reported.

See full entry

Posted by LordGarySugar on 2 April 2026 in English. Last updated on 4 July 2026.

Introduction

Welcome to The #questionable-edits OSM Iceberg!

Over the past 5 months I have been collating some of the strangest, funniest and most excruciating examples of vandalism, mistakes and creative mapping. This Iceberg takes its name from the #questionable-edits channel on the OSM World Discord where we share the weird, wild and wonderful things we’ve seen while mapping. It should be made clear, the intent of #questionable-edits (and my Iceberg) is not to mock, demean or dissuade novice mappers, but to educate about common mapping pitfalls and share some of the entertaining things that have been found. I myself am guilty of a number of things listed below! I’ve included over 80 items in my Iceberg, ranging from the well-known to the downright unhinged. This Iceberg is also available on the OSM forums.

It shouldn’t have to be said, but please do not harass or otherwise antagonise any users whose edits may be visible in these examples. The screenshots and changesets linked below are intended as illustrative examples, and aren’t intended to target individual mappers.

Happy April Fools everybody! (Yes I might be a day late, but I was last year too). Enjoy!

The Iceberg

See full entry

I really love JOSM, and the more I use it, the more I discover that it offers some very useful features… that some of you may not be aware of ! Even if some are less useful, simply knowing they exist opens up the possibility that you might find them useful!

I’d like to show them to you here.

This diary post is a follow-up to my previous one on JOSM: Building drawing tips, a perfect guide.

1st manipulation: Use JOSM

JOSM Logo

See full entry

Posted by jwheare on 31 March 2026 in English. Last updated on 1 April 2026.

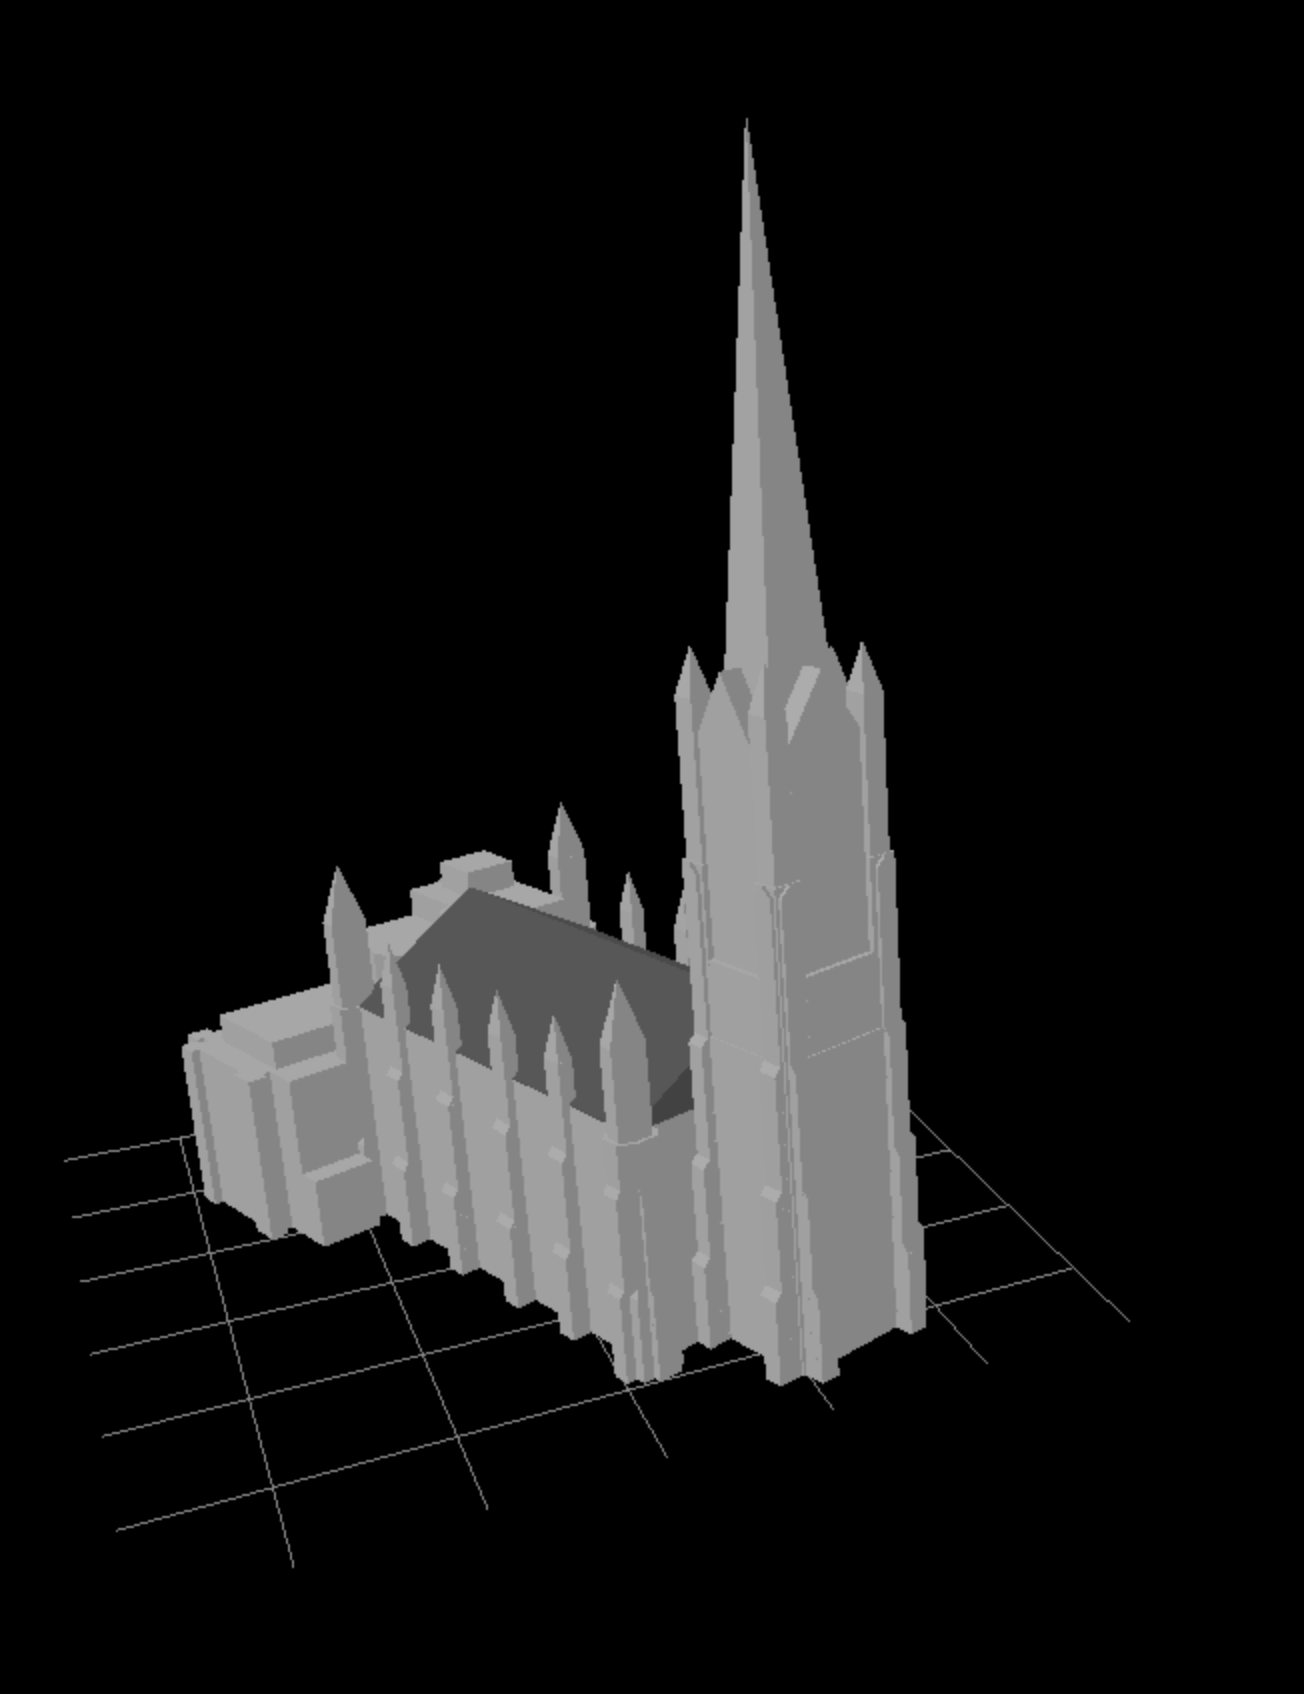
The Hub, Edinburgh rendered with Beakerboy’s OSM Building Viewer https://beakerboy.github.io/OSMBuilding/index.html?id=42997989

I’m working on a project using OSM building data so I thought I’d familiarise myself with the building:part and roof tags and see what the editing process is like.

The Hub only had height data and a basic outline tagged for the spire, so as the highest man made point in Edinburgh, it made for a good candidate to get stuck in.

I used height data from the OGL licensed Scottish LiDAR Phase 5 DSM that covers Edinburgh, and photos of the building from Wikimedia Commons

The elevation profile tool in QGIS proved useful for exploring the LiDAR data (after I worked out how to right-click to confirm the path). I normalised the elevation to zero with the raster calculator and set a custom colour ramp to aid visualisation:

See full entry

Location: Old Town, City of Edinburgh, Scotland, United Kingdom
Posted by Bill Ricker on 31 March 2026 in English.

Back “home” with Mom for the weekend, when I picked her up after church, I was advised by everyone that taking the back exit from the church parking lot. What back exit? It wasn’t on OSM or GM. (Makes sense, last time I was in that parking lot, it was all mud and construction; this exit doubles as cover for new water main or something.)

So of course I went out the normal exit, around the block and in and out of the new back entrance/exit to trace both lanes with the GPS. It is indeed now visible in our newest Mapbox imagery.

osm.org/changeset/180651021#map=17/43.834318/-70.432577&layers=VN

Location: Windham, Cumberland County, Maine, 04062, United States
Posted by assanges on 30 March 2026 in English. Last updated on 1 April 2026.

此文本同時提供 台灣華語版本 This article is also available in Taiwanese Mandarin


OpenStreetMap’s collaborative nature is both its biggest strength and a source of persistent data-quality issues. With thousands of contributors independently adding phone tags to shops, restaurants, clinics, and government offices, each person tends to follow their own formatting style. For Taiwan, that means a database where the same country code can show up as +886, +886+, or +886(2), and a single city’s worth of phone numbers might span a dozen different conventions.

This post catalogues what we found when we scanned OSM elements across all six special municipalities and five additional counties — we are working on a normalizer to fix the issue.


The Scale of the Problem

Across eleven cached regions — all six special municipalities (臺北市, 新北市, 桃園市, 臺中市, 臺南市, 高雄市) plus 苗栗縣, 新竹市, 臺東縣, 連江縣, 金門縣 — we found 49,260 tags (phone or contact:phone) on 49,229 elements. After splitting multi-value fields on semicolons, that yields 50,643 individual phone number strings to classify.

Format class Count Share
E.123 space (+886 2 1234 5678) 41,842 82.6%
RFC 3966 dash (+886-2-1234-5678) 6,655 13.1%
No separator (+886212345678) 1,158 2.3%
Local format, no country code (02-1234-5678) 854 1.7%
Corrupt/typo country code (+866 …, +886(2)…) 92 0.2%
Other (wrong country, junk) 42 0.1%

Roughly 1 in 5 individual values deviates from the most common contributor convention, creating inconsistency that complicates deduplication, display, and machine parsing.

See full entry

Location: Liming Village, Zhongzheng District, Taipei, Taiwan
Posted by Raquel Dezidério Souto on 29 March 2026 in English. Last updated on 25 April 2026.

The Virtual Institute for Sustainable Development - IVIDES.org® , a virtual research institute on the SD matter, and the IVIDES DATA®, a small Brazilian company on information technology consultancy, are lauching a new partnership with the State University of Campinas (UNICAMP) in order to use OpenStreetMap on the collaborative mapping of disaster risk for coastal communities on the nlNorthern Coast of the State of São Paulo (Brazil).


print screen of first meeting First meeting on March, 2026. Source: project collection. Map data (c) OpenStreetMap contributors.


See full entry

Location: Centro, São Sebastião, São Paulo, Southeast Region, 11608-608, Brazil
Posted by SüngerBob on 29 March 2026 in English.
%{count} contribution(s) in the last year

section on the user page, should be edited. For numbers greater than four digits, periods are placed in groups of three for easier reading, but OSM user profiles have numbers that are difficult to read, such as 1234565885. If we write this as 1.234.565.885 or 1,234,565,885. The contribution counter will be easier to read.

Yesterday, I attended the OpenStreetMap Local Chapters and Communities Congress 2026 online.

There were at least 15 participants who signed the attendance list on the event’s HackMD document, representing a range of countries including the Philippines, Italy, the United States, Canada, Greece, Indonesia, Belgium, Kenya, and Brazil. The document is available publicly here.

After introductions and updates from the OpenStreetMap Foundation Board, the session moved into a group discussion titled “Challenges in OpenStreetMap and overcoming those challenges.” This discussion was conducted through Mentimeter, allowing participants to submit anonymous responses to guided questions.

Here is a (selected) summary of the discussion results:


Question 1 : If a new mapper asked you “what’s the hardest part about being in the OSM community?” what would you say.

“So many smart people. All with their strong opinions about how things should be done.”

“Dealing with abusive community members.”

See full entry