 OpenStreetMap

I’ve just updated the contributor statistics for the whole year 2018.
As I pointed out here 2017 update blog post some the graphs look a bit odd due to the one-time effect of an initial large number maps.me users contributing as the editing feature was introduced.
This effect continued to decrease during 2018, but for completeness sake here are the updated graphs from the blog post for 2017 that continue to show continuing growth even without maps.me.
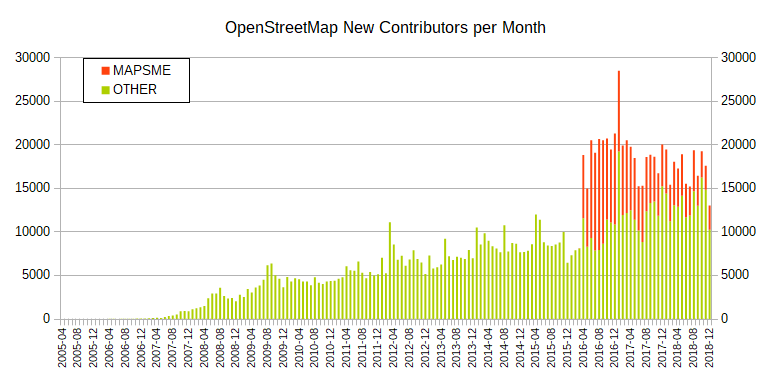
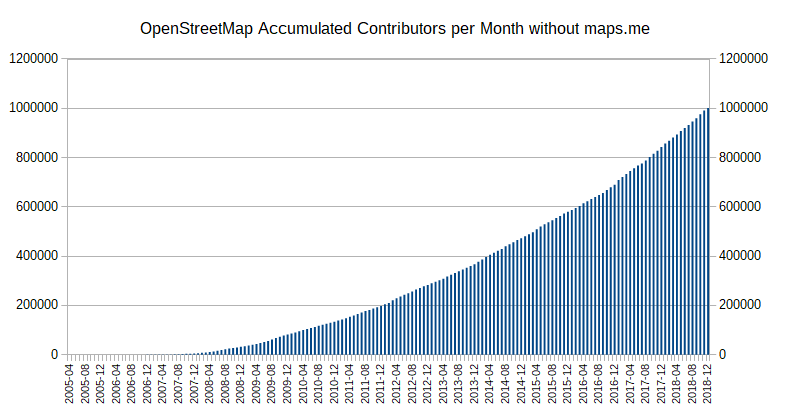
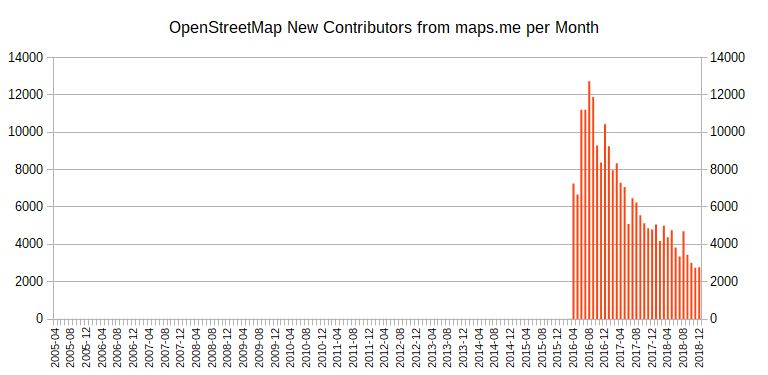
I suspect that the slight decrease in unique active contributors 2018 is due to the decrease in new mappers from maps.me too, in any case the number of mappers that edited at least in one previous year continues to grow, and as that might be the most important metric overall the numbers continue to look positive.
Discussion
Comment from TheDutchMan13 on 2 January 2019 at 03:49
Thank you for this!
Comment from apm-wa on 9 August 2026 at 20:17
Do the Maps.Me data include its forks, e.g., Organic Maps and CoMaps, or only the original Maps.Me?
Comment from SimonPoole on 9 August 2026 at 20:50
That was 2018, so there was only maps.me later stats do lump all 2 and then 3 together.