 OpenStreetMap

Teaching comes via OSMs online training session.
Diary Entries in English
Recent diary entries
Adrian Glover initiates on 9/9/23 based on introduction from Red Cross.🎉 Mapping done on T430.

Following the earthquake in Morocco last night (08-09 Sept 2023), staff from HOT’s West and Northern Africa Open Mapping Hub and OSM Morocco agreed to launch an activation to support response efforts.
If you would like to support by mapping, please do. The first project is now on the HOT Tasking Manager and more will follow.
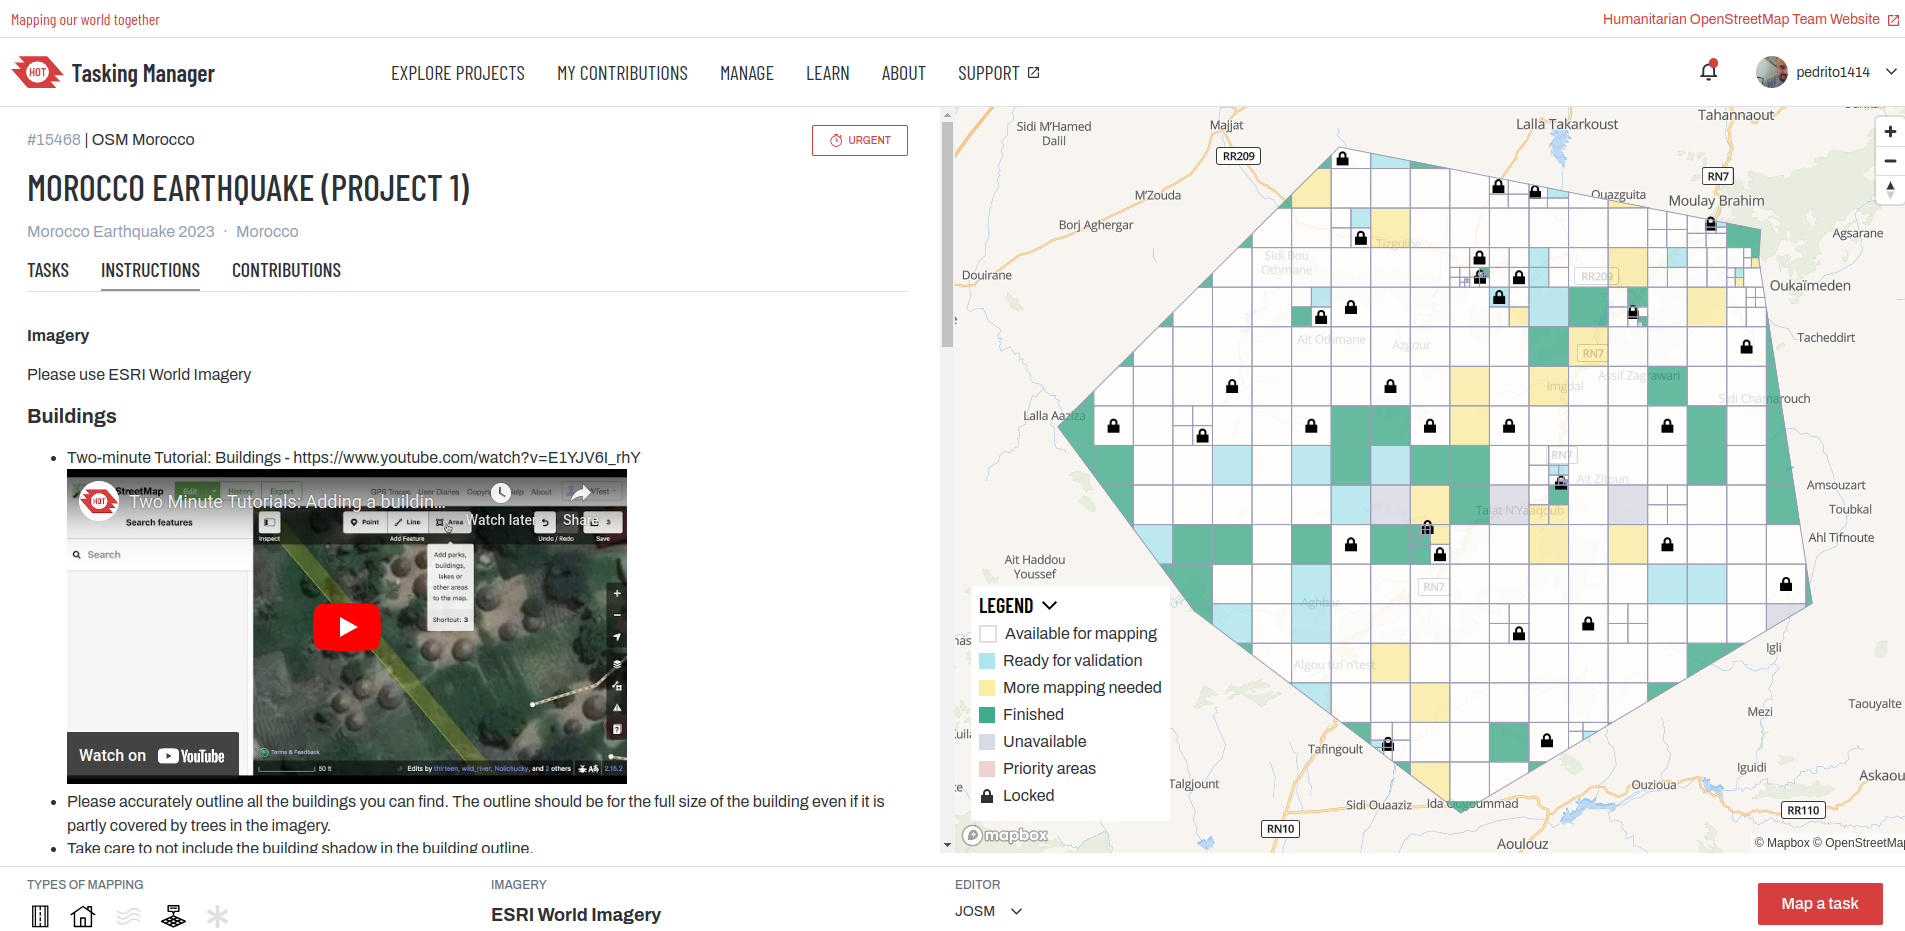
You can also keep track via the activation wiki page : 2023 Morocco Earthquake.
If you have questions or would like to engage, you can do so via the HOT slack or the OSM community forum.
Thanks in advance for your time and skills in support!
The USGS 3D Elevation Program (3DEP) is awesome. When mapping roads, creeks and trails that are covered by trees, it’s nearly impossible to use any satellite imagery in any meaningful way. Even if someone spends the time to use GPS to track a road or hiking trail, it is even harder to find someone to walk down the middle of a lot of creeks to track the path of the water flow. It’s also not uncommon for the GPS trace to be off by several feet or even have gaps in the data near tall dense trees, which reduces the accuracy of the path being traced on a map. 3DEP can help in such situations.

I believe that this data is only available for most of the US territories. So if you are mapping outside outside of the US, this may not be beneficial to use.

On the 6th of September 2023, we the members of the committee had a review on the volume of applications submitted by the applicants for SotM Africa which is slated to be held in Cameroun this year 2923. Letters were sent to the applicants whose application was not successful.
On the 8th, we concluded were 15 of the applicants made it to the top. Letters will be sent to them by the 9th of September, 2023.
Posted by umbraosmbr on 7 September 2023 in English.

Make a Donation to UMBRAOSM Union of Brazilian OpenstreetMap Mappers and keep the site in AR and your projects!

https://www.umbraosm.com.br/doacao.html
These are the data to send a Pix to the Neon account!
To send by keys: Email: umbraosm@gmail.com
Name: Roberto Borges De Sousa
Posted by umbraosmbr on 7 September 2023 in English.
State Of The Map 2023 Brazil schedule - Curitiba - 02 a 04 de Outubro de 2023
 https://sotm-br.github.io/2023/programme/
Application for State of the Map 2023

When I started getting involved in mapping on OSM around July 2021, I asked myself: “But why hasn’t anyone made a guide to help me map this country?” and indeed, there was no specific guide to contribute on North Korea!

Beginning
After learning and integrating all the basic OSM tags (including highway=*, building=*, natural=*, landuse=* etc.) and mapping some small towns of the country, I thought about creating a personal page of recurring tags for easy retrieval.
Then the idea came to me to make a thematic page on the contribution specific to this country.
Access to the terrain in North Korea is complicated, and a good understanding of satellite imagery is essential, so a guide to the subject becomes all the more relevant. So I decided to create one!
Revised Script for usage in macOS 12+ with zsh:
#!/bin/zsh
echo "Download"
wget -t0 -c "http://download.geofabrik.de/europe/andorra-latest.osm.pbf"
wget -t0 -c "http://download.geofabrik.de/europe/austria-latest.osm.pbf"
wget -t0 -c "http://download.geofabrik.de/europe/belgium-latest.osm.pbf"
wget -t0 -c "http://download.geofabrik.de/africa/canary-islands-latest.osm.pbf"
wget -t0 -c "http://download.geofabrik.de/europe/czech-republic-latest.osm.pbf"
wget -t0 -c "http://download.geofabrik.de/europe/denmark-latest.osm.pbf"

echo "Convert"
./osmconvert --drop-version andorra-latest.osm.pbf -o=andorra-latest.o5m
rm -rvf andorra-latest.osm.pbf
./osmconvert andorra-latest.o5m -o=merged.o5m
rm -rvf andorra-latest.o5m

for FILE in ./*.osm.pbf; do ./osmconvert --drop-version $FILE -o=$(basename $FILE .osm.pbf).o5m; ./osmconvert $(basename $FILE .osm.pbf).o5m merged.o5m -o=merged_cache.o5m; rm -rvf $(basename $FILE .osm.pbf).o5m; mv -v merged_cache.o5m merged.o5m; done

echo "splitter"
## latest splitter Version r653 used
java -Xmx5G -jar splitter-r653/splitter.jar --output-dir=tiles --max-nodes=1200000 merged.o5m

echo "mkgmap"
## latest mkgmap Version r4910 used
## template 2022pn.typ used, use what you like :)
java -Xmx5G -jar mkgmap-r4910/mkgmap.jar --country-name=OSMMap --family-name="OSM map" --product-version=1 --bounds=bounds-latest --dem-interpolation=auto --make-poi-index --poi-address --unicode --index --split-name-index --gmapsupp --report-routing-islands -c mkgmap-r4910/examples/sample.cfg -c tiles/template.args 2022pn.typ --style-file=../ --check-styles --route --net --gmapi --add-boundary-nodes-at-admin-boundaries

echo "final clean up"
rm -rvf *latest.o5m
rm merged.o5m
cd tiles
rm -rvf *.osm.pbf
cd ..
rm -rvf 6*.img
rm -rvf ovm_6*.img

echo "The End"

Tree mapping is a task that is better done in person than using aerial imagery, unless it is a tree row. The reasoning being that node placement of natural=tree is more precise than looking from above, since more often than not the imagery is not that clear.
Trees tell a story
When looking at this area it is fascinating how one can make out man made structures relative to the placement of trees.

Further once adding the leaf_cycle and leaf_type one can create shade maps that could be practical during heat waves like at mapasdesombra.org or if jveuxdusoleil.fr extended its algorithm to include tree details as well.
One can add the tree’s height and diameter with a check date to create a timeline of the tree’s lifespan, though also add more potential data points in ecological terms.
Or one can add the genus and/or species to ease the search for foragers like mundraub does with their overlay map.
Tree specification

The damn deploy repository of the Divide and map. Now. has been refactored. And that’s a great opportunity for another round of load testing.
This is the third round of load testing, see the first and the second one if you are interested.
The load testing is a bit different from the last time. I performed load testing of new, freshly deployed damn project instance on $6/month VPS with 1 GB RAM, single 2.5 GHz vCPU, and 25 GB SSD. (The changes from the last time are that there is no more load testing of the “production” server, the price increased by $1/month, and shared_buffers is now 256 MB instead of 409 MB.)
The preparation for load testing on the server’s side, when the damn project is deployed, is just to run
docker-compose -f damn-deploy/gen.yml run --rm prepareloadtest
to create 1000 test users and 10 (load) testing areas in the database. For each run of load testing, the database has been deleted and created again with
systemctl stop damn-http.service
reboot
docker volume rm damn-deploy_damndb-volume
systemctl start damn.target
docker-compose -f damn-deploy/gen.yml run --rm prepareloadtest
commands. For each run of load testing, log the server’s utilization with
sar -o load-test-100 -A 15 $((4 * 61)) 1>/dev/null 2>&1
Then, from that file, you can generate data series and plot the graphs with
./get-info.sh 100
gnuplot plot1.pl
gnuplot plot2.pl
where the content of the corresponding files is
get-info.sh:

… unless you want a greatbighuge label inexplicably hovering over the map at z=16.
Looking over this fine city of Toronto, I saw a couple of brown labels for places that are sort-of not real. Exporting and grepping local exports showed me they were landuse ways with a name value set.
I’m sure there are plenty of good examples where a landuse area would have a name. In these cases, though:
-
one was the name of a city/developer study from roughly five years ago that has disappeared from the record since then. Will it become a neighbourhood name? Who knows, but that’s for the future and not for us to force. (fun fact: it’s apparently the densest concentration of office workers in the city. Less fun but very Toronto fact: there is no dedicated transit there. I had a job there ~2006–2008 and new transit was planned, but then the trainwreck formerly known as Mayor Rob Ford happened so it didn’t.)
-
one was a drive-by tagging error by an out-of-band specialist. I really think they meant it for a bus stop.
Aligned with my personal policy of “Only kvetch after fixing”, they’re gone and our z=16 will be so much less jarring. Thank me later.

Posted by umbraosmbr on 2 September 2023 in English.
Location:
-25.432, -49.270


The Standard Tile Layer has a lot of traffic. On August 1st, a typical day, it had 2.8 billion requests served by Fastly, about 32 thousand a second. The challenges of scaling to this size are documented elsewhere, and we handle the traffic reliably, but something we don’t often talk about is the logging. In some cases, you could log a random sample of requests but that comes with downsides like obscuring low frequency events, and preventing some kinds of log analysis. Critically, we publish data that depends on logging all requests.
We query our logs with Athena, a hosted version of Presto, a SQL engine that, among features, can query files on an object store like S3. Automated queries are run with tilelog, which publishes files daily to generate published files on usage of the standard tile layer.
As you might imagine, 2.8 billion requests is a lot of log data. Fastly offers a number of logging options, and we publish compressed CSV logs to Amazon S3. These logs are large, and suffer a few problems for long-term use because they:
- contain personal information like request details and IPs, that, although essential for running the service, cannot be retained forever;
- contain invalid requests, making analysis more difficult;
- are large, being 136 GB/day; and
- become slow to query, being compressed gzip files with the only indexing being the date and hour of the request, which is part of the file path.
To solve these problems we reformat, filter, and aggregate logs which lets us delete old logs. We’ve done the first two for some time, and are now doing the third.

How do we better organize to support the Humanitarian OpenStreetMap Team organization, staff, membership, and community? We have been on a journey to open up and consider what is the best way forward for HOT’s Governance. Now that we have the HOT Living Strategy, we have more incentive to imagine how we might evolve. We are taking stock of our governance and investigating how we might be able to encourage more people to engage in the governance of HOT.
The HOT Governance Working Group (GWG) started the process of research and engagement with the HOT membership in January 2023. We’ve documented this process in the GWG meeting minutes. Together we designed a terms of reference to hire support to help us research some initial bylaw adjustments and wider organizational needs and structures.
Our first big research is exploring how we govern with the board and to better support the membership chair. There will be future steps and research to consider the role of the membership and how we collaborate with the Open Mapping Hubs.
The board and membership asked us to consider the following topics: the possibility of appointed board members, board member stipends, and membership chair term. See the current HOT bylaws
Why the proposed changes
The HOT voting members have a wide range of skills, and have brought much insight and change to the organization. Currently, HOT’s board is elected from and by the voting membership. Over the past years, HOT board and organization have identified gaps in key expertise for the board, including legal, finance and large-scale fundraising. This has been documented in various OSM diary posts, the HOT board election discussions, and the Board and GWG meeting minutes.
Posted by lhirlimann on 29 August 2023 in English.

Last week I had a week of vacation in beautiful Greece. As I needed to do some kind of daily exercise, I decided to walk and played with streetcomplete. I’ve been off the app for a few months due to lack of motivation.
After one hour of going around and adding things I looked at my profile and was #1 on Greece what a shock.
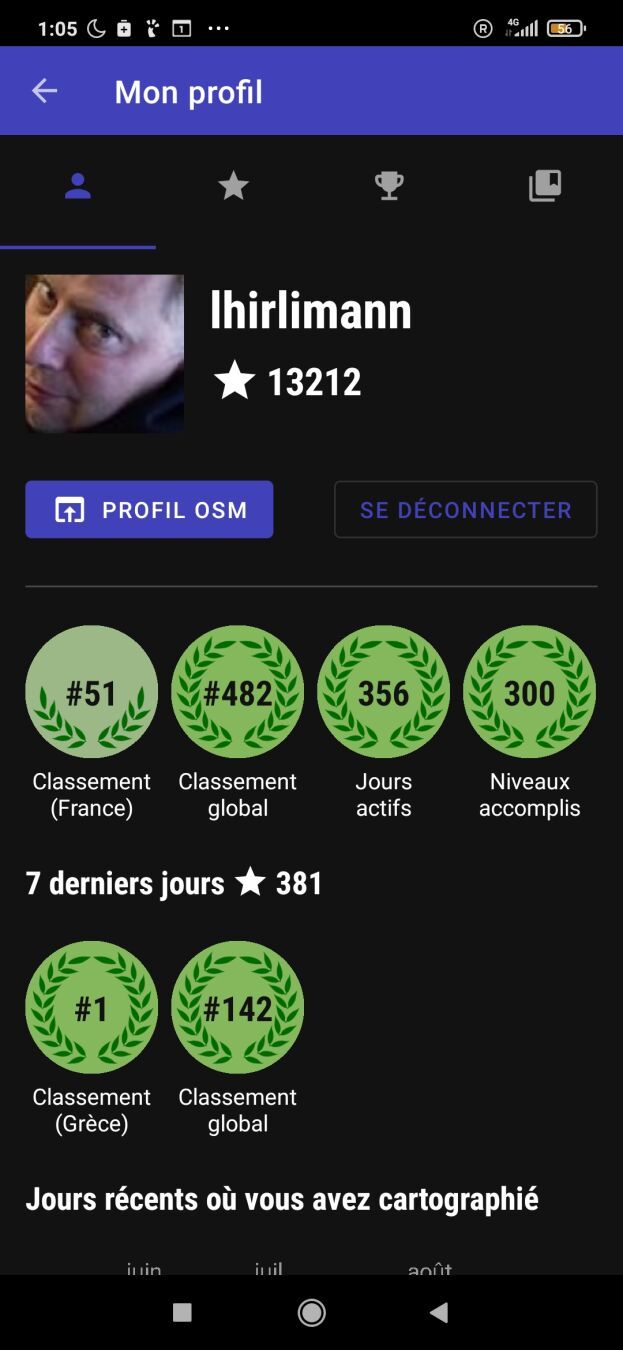
Wondering how that could be?
- Are all greeks using iphone? (I doubt)
- Is no one using OSM in Greece? (I doubt)
- Is Streetcomplete missing some greek translation (probably, I didn’t check).
- Am I the only one doing streetcomplete while on vacation?

OSM에는 왜 이렇게 흐릿한 갈래가 많을까……
외국 사람들에게 한국의 ‘곰’, ‘탕’, ‘국’을 갈래지으려면 갈래지을 수 있을까?
도대체가 말이 안 되는 짓거리를 언제까지 하고 있을 건가…… ㅡ.ㅡ
Why does OSM have so many fuzzy branches……
Is it really possible to make Korean ‘gom’, ‘tang’, and ‘guk’ forked for foreigners?
How long are we going to keep doing this nonsense…… ㅡ.ㅡ

I am contributing to OpenStreetMap because I want to make the world a better place by adding verified information.

Hello! Today, I want to share a handy script that can enhance your experience with JOSM on MacOS by enabling a dark mode theme. Dark mode not only looks sleek but can also reduce eye strain, especially during late-night mapping sessions.
Note: This script is specifically for MacOS users.
Step 1: Download JOSM
If you haven’t already, download the latest version of josm-tested.jar here. Save it to a location on your Mac.
Step 2: Install the FlatLaf Plugin
FlatLaf is a fantastic plugin that allows you to apply dark themes to Java applications. After installing the plugin and restarting, go to the menu and select the dark theme: JOSM → Settings → Display → Look and Feel → FlatLaf Darcula
Step 3: Create and Run the Script
Now, let’s create a script that will launch JOSM with a dark theme. Open your favorite text editor and paste the following code:
shell
#!/bin/zsh
java -Dapple.awt.application.appearance=NSAppearanceNameDarkAqua -Xmx7168m -jar /Users/YourUsername/Documents/josm-tested.jar
Make sure to replace YourUsername with your actual MacOS username. This script does the following:
-
#!/bin/zsh: Informs your system to use the Zsh shell to execute the script. -
java -Dapple.awt.application.appearance=NSAppearanceNameDarkAqua -Xmx7168m -jar /Users/YourUsername/Documents/josm-tested.jar: Launches the Java runtime with dark mode enabled, allocates 7168MB (or 7GB) of RAM to JOSM (you can adjust this value), and specifies the path to your JOSM JAR file.
Step 4: Save and Make the Script Executable
Save this script with a .command extension, for example, josm-dark-mode.command. To make it executable, open your terminal, navigate to the directory where you saved the script, and run the following command:
shell
chmod +x josm-dark-mode.command
Step 5: Execute the Script
Now, you can simply double-click josm-dark-mode.command, and JOSM will launch with a beautiful dark theme, thanks to the FlatLaf plugin and the MacOS appearance setting.