
English translated by P. Verdy himself
Texte Français par P. Verdy
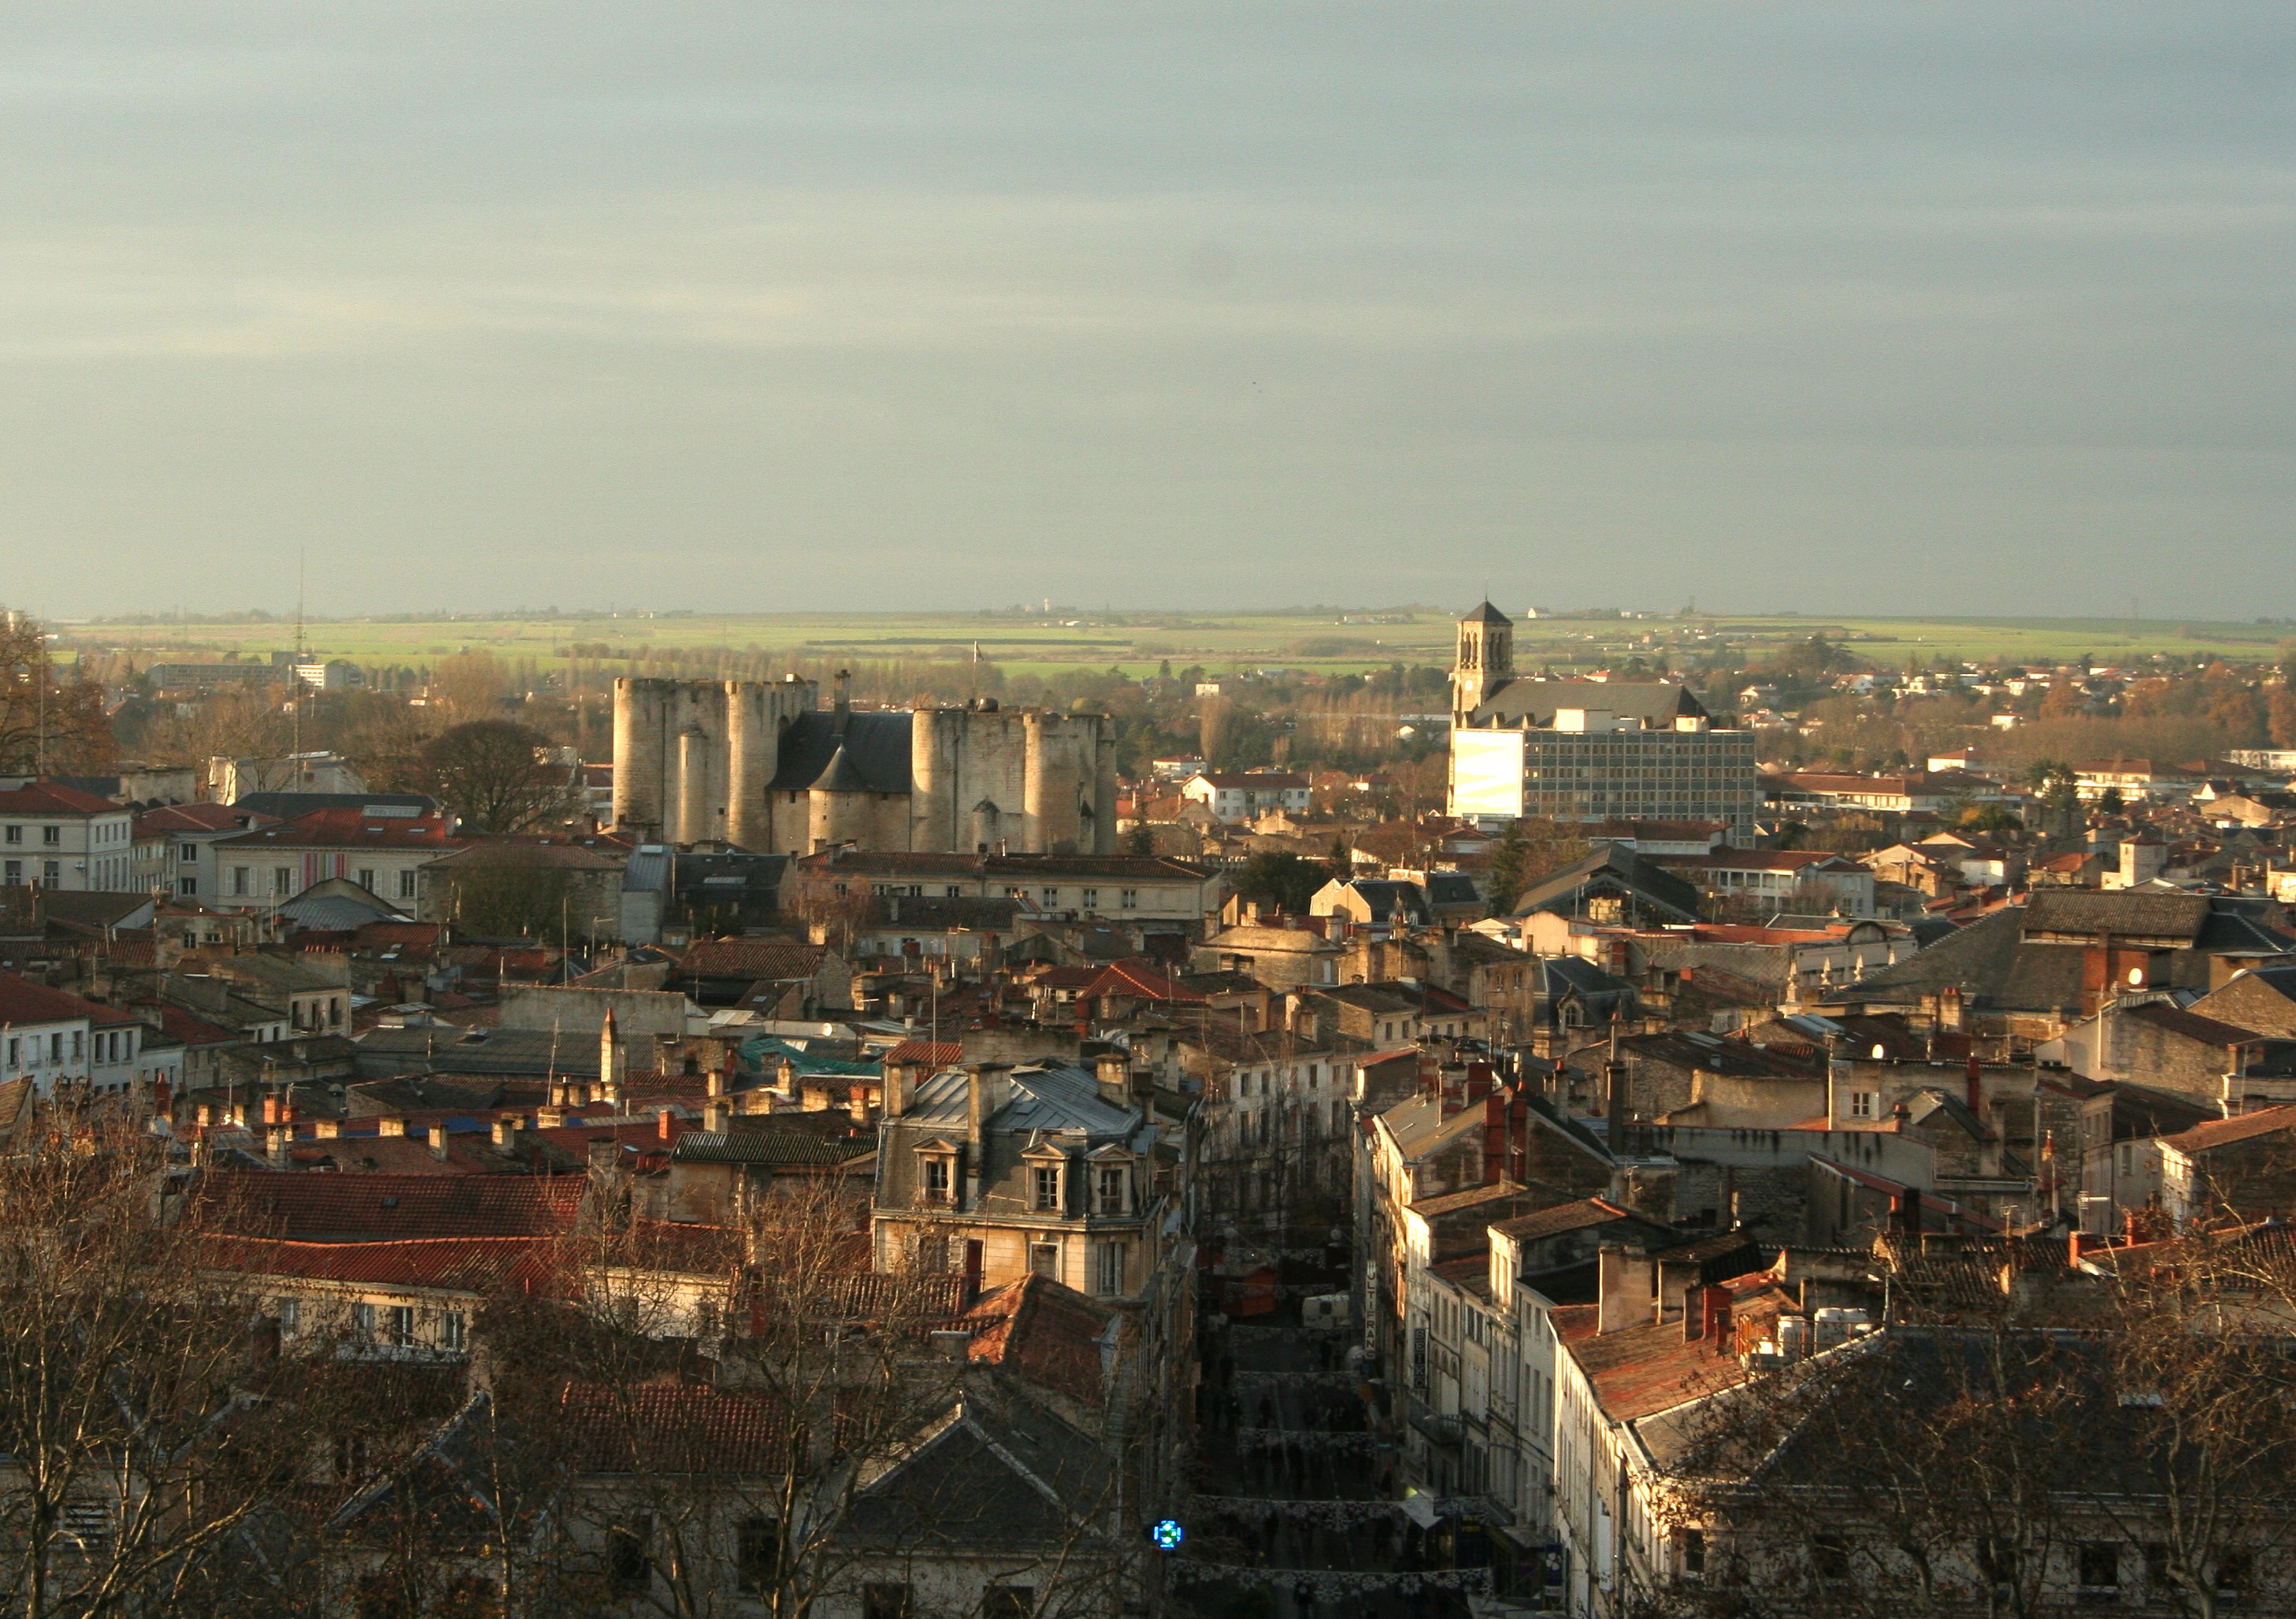 Jeffdelonge (Own Work) [GFDL (http://www.gnu.org/copyleft/fdl.html) undefined CC BY-SA 3.0 (http://creativecommons.org/licenses/by-sa/3.0)], via Wikimedia Commons
 OpenStreetMap
English translated by P. Verdy himself
Texte Français par P. Verdy
Jeffdelonge (Own Work) [GFDL (http://www.gnu.org/copyleft/fdl.html) undefined CC BY-SA 3.0 (http://creativecommons.org/licenses/by-sa/3.0)], via Wikimedia Commons
OSMCha is a an open source changeset exploration tool originally created by Wille Marcel. Early 2016, few of us at Mapbox were interested in using this tool for trying out validation on a changeset level. Over the course of 2016, we made several improvements to the tool. As of this morning we reviewed more than 23000 changesets and found 1150 to be harmful to the map. OSMCha database consists useful changeset metadata such as changeset ID, username, editor used, changeset comment, source, imagery used, and timestamp.
You can download a CSV of all the reviewed changesets here. For community members who are interested in validating the map using OSMCha, our validation guide can be a good starting point in understanding the tool, how we use it and validate their own neighborhood.
OSMCha does not parse all changesets from OSM. There are a few that go unparsed each day because of various edge cases that we are working on fixing. So do not take numbers on OSMCha as absolute but as near accurate estimates.
Some of the mapping activity marked as harmful in OSMCha are not necessarily harmful. Undiscussed, unannounced imports in OSM are constantly tracked and reverted by the DWG. These edits to the map do not necessarily have mapping mistakes in them but were found to be uninvited into the map to maintain a data import protocol, accuracy on the map and local community accord.
Hence, mass deletion of above imports in revert changesets by DWG cleanup accounts like Woodpeck_repair are also marked as good edits. These can be ignored by filtering out repair accounts.
The reviewed changesets were from random places on the map and are not specific to any place. For area specific filtering we can take advantage of bbox filter in OSMCha or filter manually as the CSV contains the bbox information for each changeset.
I’ve been mapping lots of countryside in Gansu, China, and the number of temples is quite high.
In the predominantly muslim areas, mosques are usually very easy to recognize (although I hope I didn’t miss too many because of tunnel-vision), due to the usually square main building with a central dome, surrounded my 2 or 4 minarets.
Buddhist and Taoist temples however, are impossible to distinguish for me, as someone with only basic knowledge of Chinese architecture and these two religions. On the ground I would probably be able to, but with the number of local mappers in rural Gansu and my travel budget not being impressively high, all there is left is studying Bing imagery.
Some examples:
Without looking, can you tell which one is Buddhist? Of those listed, one was documented, so I could confirm (or rather, correct) that is is Buddhist: osm.org/way/454051191
Besides purely looking at the architecture, the location also gives things away of course. In a Hui autonomous county, you expect to find more mosques, in a Tibetan Autonomous Prefecture, you expect more Buddhist temples. Some temples are located on hilltops, others within a residential area and others are surrounded by farmland. I don’t know what significance this has, but surely, there must be some.
If you know the name of the temple, this can apparently also give you a hint. https://en.wikipedia.org/wiki/Chinese_temple
Chinese religion experts, please let yourself be heard in the comments or via a message.
Here is the visualization of features I added/edited around Poblacion, Batangas City and nearby barangays:
…and for the whole city, including portions outside the city boundary:
Dear all,
Today, v3.0.0 of the openstreetmap-carto stylesheet (the default stylesheet on openstreetmap.org) has been released.
Major changes include
Changes include
Thanks to all the contributors for this release including jojo4u, a new contributor.
For a full list of commits, see https://github.com/gravitystorm/openstreetmap-carto/compare/v2.45.1…v3.0.0
As always, we welcome any bug reports at https://github.com/gravitystorm/openstreetmap-carto/issues
There is a very-mysterious “Gedling Wharf” on the OS_OpenData_StreetView north of Arnold Lane and, having finally been able to join together just what it was and where it was, I’ve added it to the map.

The Wharf (more accurately “Bottom Wharf” — see Gedling Country Park) was where Gedling Colliery distributed coal from the pit:–
>
- Coal was sold from the Top and Bottom Wharfs:
- The Top Wharf was at the top of the colliery site (now Chartwell Heights) and was the main selling point for domestic sales to local firms Leapers and Trumans.
- The Bottom Wharf was closer to Gedling village (the old Grey Goose Pub, now Gedling Village Care Home). From here coal was sold directly from the weighbridge. Leapers would deliver coal collected from here to all local miners.
via The RISKS Digest Volume 30 Issue 04:
Rail Crossing Warnings Are Sought for Mapping Apps
http://www.nytimes.com/2016/12/19/technology/google-digital-maps-railroad-crossings-ntsb.html
The National Transportation Safety Board asked tech companies to add the locations of grade crossings into digital maps and to provide alerts for drivers.
So the US NTSB are asking “the other map companies” to provide locations of railway=level_crossing or at-grade intersections of highway=* and railway=* ways? Hmm, if only they knew people not just providing ad platforms as scrolly bitmaps to further distract drivers …
This changeset look suspicious where a user added lot of point’s of interest like amenity=coffee, and amenity=beauty shops in Mexico city, Mexico. The user used Maps.me editor to add data.

My colleague @upendrakarukonda has left a comment on the changeset 3 months ago and removed only coffee shops. Again, I’ve commented for the second time on another changeset. We didn’t observe any reply from the mapper since. So sharing here with the community to examine beauty care places and take necessary actions.
Thank you
Now that much of Guarapari have had buildings designed (the rest probably being added shortly as there is a drawing frenzy going on), and I am alone with the dog, than I have been looking for something useful to do. Luckily there is something called FieldPapers where I can print out small maps, put them on a clip board, and make notes as I walk the dog. That would mean I would need to walk the dog in different routes every day in order to cover more ground, but so be it. I am ready for my first test now, the streets around my house. Goal: harvest addresses and floor numbers for all mapped buildings.
Living in China isn’t all that bad. But in FUzhou the summers will boil you. But never fear….
There are spots all around in the mountains which provide GREAT relief. Check it out yo. I’ll be posting my tour of the Fuzhou mountain areas, roads, swimming holes …….
If you haven’t checked OSM in the last few months, you’ll be surprised to see that many houses (and buildings) have been added in Kamloops. - I did most houses on the North Shore - I completed Sun Rivers - I finished Juniper - I just finished Valleyview
Since many people are now using Maps.me in order to add POIs, having the buildings ready makes the operation very easy.
My September diary entry contained a view from near the top of Marshall Hill, looking north down the length of Chatsworth Avenue at the spire of All Hallows Church in the middle distance (All Hallows is the CoE parish-church for Gedling village). I believe that that was my first photo of that church spire.
My mapping since September seems to have taken me in a clockwise-rotation around the spire, and I am now approaching the church from the west.
Most householders do not like having photos taken of their homes, and I try my very best to respect that. At the same time, I know that panoramic shots of a district are one of the best ways to allow strangers to get a feel for an area, and I do my best to include such shots if I’m lucky enough to come across one.
Below is, I believe, only the 2nd shot that I’ve taken of the Gedling Spire. It is at a very similar distance to the first (as listed at top), but this time looking east from a walk at the top of Linby Close:—

In which I outline the need for the recent junction=circular tag.
Traffic circles are a modern feature of intersection design. They come in multiple forms and shapes.
OSRM distinguishes between roundabout intersections, named, and unnamed roundabouts. Roundabout intersections are a special case of roundabouts that are small and offer up to four clearly distinguishable exits.

To be considered a roundabout in the strict sense the road junction has to follow certain criteria. One of the criteria for a roundabout is that traffic in the roundabout has the right of way.
There are circular junctions which may look like and be commonly identified as roundabouts, but they are not roundabouts because they do not fulfill all of the criteria for being a roundabout.
OpenStreetMap is an international community of citizens, experts in open geographical data from different perspectives and specialties, and in collaborative methods to build information. OpenStreetMap is part of the Voluntary Geographic Information movement.
The Mexican OpenStreetMap chapter in preparation is involved in 3 main lines of action:
As a global community and ecosystem of technologies, OpenStreetMap has participated in the past in several initiatives of informal transport mapping. This lack of good transport systems and lack of data is crucial in developing cities.
These operations usually pretend to:
Over the past few days I have been using Osmose (docs) to find errors in administrative polygons in Ireland. OpenStreetMap does not have a native area type, so we have to create type=boundary relations. It’s easy to break these areas, which means software which wants to extract boundary data from OSM is unable to “see” these areas.
As someone who consumes OSM data for administrative boundaries (Townlands.ie for townlands in Ireland), I have a certain affinity for admin boundaries in OSM in Ireland, and would like T.ie to be as good as possible, and that’s possible if the OSM data is the best possible.
I’ve been turning off all checks in Osmose and enabling just the open polygon error. Click on each blue marker to open the popup with details. Then click the “josm” link for the relation with the problem, which will load that relation in JOSM using JOSM’s remote control. The JOSM validator will then tell you where the open polygon is. You should then look at the problem and see what’s wrong and how to fix it. The most common error is a small gap, and there’s a missing way that you need to (re-)add to the relation. However I have seen more complicated errors sometimes.
Osmose will update regularly, but it can take a day before it’s updated, so the “polygon error” will still be on the website. You can click on the “corrected” link in the popup to tell Osmose that this problem has been fixed. The popup & marker will then disappear from the map (for everyone). You can then clear the errors and work on the next problem. Sometimes I’ve seen many copies of the same error on top of each other, so if you click “corrected” and it looks like the popup & marker don’t disappear, it probably did get recorded as corrected, it’s just that there’s an identical error in the same place which you’re seeing. Just click “corrected” on all of them until it goes away.
Today is the final day of the board elections for the US chapter of OpenStreetMap (OSM-US). Just a few days ago the international OpenStreetMap Foundation (OSMF) also held its elections. If you are a member of both groups, you may have noticed that the two organizations do their elections a bit differently. In OSM-US elections you just choose from a list of candidates, while in OSMF elections you rank the candidates in order of preference. What are these two systems, and which one is better? Well, I’m glad you asked…
The international OSM Foundation uses a system called Single Transferable Vote (STV). STV allows voters to rank candidates in order of preference, and produces a proportional result (meaning, for example, that 40% of the voters can choose 40% of the seats on the board). OSMF has been using STV in their last few elections, and Richard Weait wrote some detailed post-mortems of these recent elections, such as OSMF Board Election Results 2015, and the more descriptive OSMF Board Election Data 2014. He has more blog posts on STV here.
OSM-US currently uses a non-proportional Block Voting system (technically, “Plurality-at-large voting”) where each voter can choose five candidates, and the candidates with the most votes win. While this voting method is easier to implement, it requires the electorate to vote strategically, rather than expressing their true preferences. Also under this system, there is the potential that 51% of the electorate could choose all five seats on the board.
So which method is better?
STV performs better than Block Voting in a few key ways:
First, voters can express themselves more fully because they rank the candidates from their most favorite to their least favorite. Voters don’t have to make arbitrary binary choices of who’s in and who’s out.
Thanks to this diary entry, I just discovered a Wiki page Date namespace which exists there since 2014 as an improperly published proposal. Basically, it is about an introduction of syntax that supposedly gives us the ability to indicate a date range for virtually any key. Proposed syntax looks like this:
<key>:<year>-<year>=<value>
<key>:<date>--<date>=<value>
<key>:<year>-=<value>
<key>:-<year>=<value>
Unfortunately, I haven’t been aware of this until today, but it’s never too late to address it.
First of all, storing a variable value in a form of colon-delimited suffix (or prefix) is not the same as utilizing a namespace because namespace always serves a purpose of grouping. So, this proposal has nothing to do with a namespace.
The second problem is that variable colon-delimited suffix makes data processing awfully redundant. With a proper namespace suffix, it is easy to compare it with a set of known ones within a simple query, while the date “namespace” syntax requires a complex regex (including an ISO 8601 date format pattern) to find all keys containing it. There is no way to “just” select them all because this scheme does not include a qualifier of any kind. Even a bit improved syntax like <key>:daterange<year>-<year>=<value> would allow way simpler preprocessing, but it didn’t happen.
You can read more detailed explanations of these two main issues on Talk:Proposed features/Date namespace page.
I am perfectly aware of at least one web service, where developers have managed to utilize this data salad, but it only means that they had enough free time on their hands. Anyone who wants to argue is welcome to start from writing an Overpass Turbo query, showing the names of Irish counties for a specific date (say, 1920) and showing it here in comments.
Townlands.ie now displays the historic name of areas! Townlands.ie is a website which shows the Irish traditional boundaries in OpenStreetMap, like townlands, civil parishes, baronies and counties. It’s very useful for Irish genealogical research, and mainting Ireland’s heritage into the digital era.
An example of this is County Offaly, which was initially created as a county in 1556 as “King’s County”, and was known as that until Irish independence in 1922, when it was changed to County Offaly. Neighbouring Co. Laois was known as “Queen’s County”.
We use the date namespace suffix to support this. The current OSM relation for Co. Offaly shows how to add this data: name:1556--1922=King's County, name:1922--=County Offaly
Townlands.ie currently supports the following 3 forms. Other options may be added later.
name:--YEAR: Name before YEAR
name:YEAR--: Name from YEAR to the presentname:YEAR1--YEAR2: Name between the years YEAR1 and YEAR2
There is already support for adding the name Griffith’s Valuation (with name:griffithsvaluation tag), and the 1901 and 1911 census names (name:census1901 and name:census1911). However that is often used for transcription errors.
Please add more historic names to OSM in Ireland!
In year 2015, 344 disasters triggered by natural hazards were reported worldwide, affecting 108 countries and nearly 142 million people. That’s 344 times that local communities and organizations, local and national governments, and international organizations needed geographic information on the affected area to inform a rapid and effective response. Unfortunately, there are still many places across the world which lack this basic geographic information, remaining unmapped.
Detailed maps give individuals, organizations and governments’ information to support them in planning DRR activities and preparing for crises. Detailed maps also help humanitarian response actors to get aid where it is needed most, by helping to understand the population size and density, as well as identify and address logistical challenges. Efforts are being made to address the lack of maps in the most neglected places.
Humanitarian OpenStreetMap Team (HOT) is a global NGO that creates and provides digital and print maps to address the world’s toughest challenges. In times of crisis and natural disaster, HOT rallies a network of volunteers to rapidly produce maps relied upon by humanitarian relief organizations to reach those in need.
A common question about aid is, does it work? In some cases, yes, but not always. Unfortunately, nothing in life is that straightforward. When someone external comes in to do the work and eventually returns home, they leave with the skills and knowledge of the project as well, so how is this sustainable? We believe initiatives carried out by community members, not only provides local knowledge, which instantly enhances the project, but the skills and knowledge associated with the project remain in the area and continue to be applied.
Bonner district


