OpenStreetMap
Diary Entries in English
Recent diary entries

I have just read in the OSM weekly that Michal has published analysis of the OSMF 2021 survey. I thank him, and others in the OSM community for the time and work spent on this.
Re-visualising the responses
One thing that drew my attention, is the visualisation of the 5 “sentiment” questions from the survey. The questions had Likert-style response options, where the respondents could either disagree or agree with the statement. There was also a neutral option in the middle. Such data are better visualised using a diverging colour palette. Since Michal kindly released all the files through github, I could recreate the maps using what is, in my opinion, a more suitable visualisation.
1: Code Of Conduct

2: Fundraising

The first beta release of Vespucci 15.2 has just become available on googles play store, alternatively you can download it from releases in Vespucci repository.
While it would always be nice if as many users as possible could test this as fast as possible, this year due to events outside of our control (bintray demise, mapillary sunsetting its current API at extremely short notice, not to mention the usual multiple man weeks of work due to googles requirements), we need to get this release out of the way asap, any help with that would be appreciated.
Dedicated address mode and address handling improvements
When we introduced the “simple mode” in Vespucci 12 in 2019 there was no way to directly add address nodes without switching to the old element creation mode via long press (you could however add a node and then predict the address in the property editor). To make this a bit easier 15.2 introduces a dedicated “Address” mode that switches the “plus”-button to allow adding
- an address node (including automatically adding an entrance tag if the node is on a building outline)
- an address interpolation
- a map note
Further improvements include support for addr:block, addr:conscriptionnumber and addr:block_number in the address tags preference, and the use of information from geocontext project for region specific default address tags.
Support mode specific launcher shortcuts
After adding a short cut for the “help” system in 15.1, we’ve added further short cuts for specific modes: Indoor, Tag-only and Address.
In launchers that support the functionality short cuts can be accessed by a long press on the app icon, and dragged to create short cut links for direct access.
Support merging closed ways/polygons
Basic support for merging two closed ways/polygons has been added to the multi-select mode. If their are no common nodes, or if the function dedects inner rings this will create a multi-polygon, otherwise a single closed way.
Posted by c tito young on 8 March 2021 in English.
Last updated on 17 April 2021.

Several 25m wide x 30m long etched geoglyph heads lay side by side on two separate hillsides separated by a moderately sloped valley. Most the heads are oriented north (forehead) to south (chin). Some of the heads, when side by side, will share common edges and lines. Additionally a proportion of heads appear anatomically correct while others appear highly abstract. It is possible that from some perspectives some of the heads might appear anatomically correct.
14°40′32″S, 75°12′60″W -14.6755618, -75.2165580 Changuillo, Province of Nasca, Ica, Peru
Posted by InfosReseaux on 8 March 2021 in English.

Starting January 2021, Enedis and OpenStreetMap France, OSMF French local chapter, entered together into a 3 years term partnership. It’s a significant step forward for data exchange and collaboration between OpenStreetMap community and utilities companies. Enedis started to publish some of its data under an open data Licence back in 2015 and now wished to ally to a well-known project like OSM to encourage crowdsourcing in a virtuous way.
Enedis operates the public electricity distribution network of 95% of Metropolitan France. It was the first European distribution system operator to get involved in open data by sharing useful assets for environmental transition and public service. Sharing its network cartography is particularly useful for OSM community since 2018.
This partnership is part of Enedis 2020-2025 Industrial strategy and as well in OSM France strategic roadmap to improve OSM usage and institutional contribution.
Partnership as a win-win solution
According to this partnership terms and conditions, Enedis agreed to provide more open data related to its operated infrastructure and aerial imagery at 5-cm resolution scale produced on a part of Metropolitan France over surroundings of power distribution grid. These pieces of imagery will be dedicated to OSM contribution only and will be usable as background in most of existing editors (JOSM, iD, …). This will serve common business topics shared by both Enedis and OSM France such as * Overhead power poles and lines mapping * Comprehensive surface power street cabinets inventory * Up to 4 other topics could be defined during this 3-years term.
My name is Saruro Titus and i just joined MapUganda Internship Cohort 2 .I am am really excited to learn GIS and also contribute to OpenStreetMap to help solve some challenges in our country. I see this as great opportunity to network with new friends and share skills and knowledge with a community of like minded people.

This is a short diary entry to announce the publication of a project I’ve been working on for the last month or so called OSM Queries.
It’s a website containing a small, but growing, collection of useful Overpass API queries. This includes a 26 part tutorial that covers most of the core features of the language and a syntax reference.
The website is generated using an open source tool that can generate HTML pages from a collection of Overpass queries.
For more details, read my blog post announcing the project.
Posted by c tito young on 5 March 2021 in English.
Last updated on 17 April 2021.
A geoglyph of a figure 60m long x 40m wide oriented east (head) to west (feet) on moderately sloped land is depicted as appear in pursuit by an alligator. The etching of the alligator, just 15m away is drawn moving in the same direction and path as of the man. It is unclear to determine if the man gets away or not from the alligator. The man appears to be doing a crawl stroke.
15°16′58″S, 74°32′23″W -15.2827612, -74.5398436 Acarí, Province of Caravelí, Arequipa, Peru

Last 20 February, I hosted an OpenStreetMap workshop and Mapathon with the local YouthMappers chapters in the Philippines. It was attended by the members and volunteers from UP Resilience Institute Youth Mappers, FEU - Alabang ACM Chapter, and JPCS - National University. Together, we mapped San Ignacio, Tarlac. This was a great avenue for the students to meet and get together and help the local government of San Ignacio and support MapBeks’ initiative #UNMAPPED2021
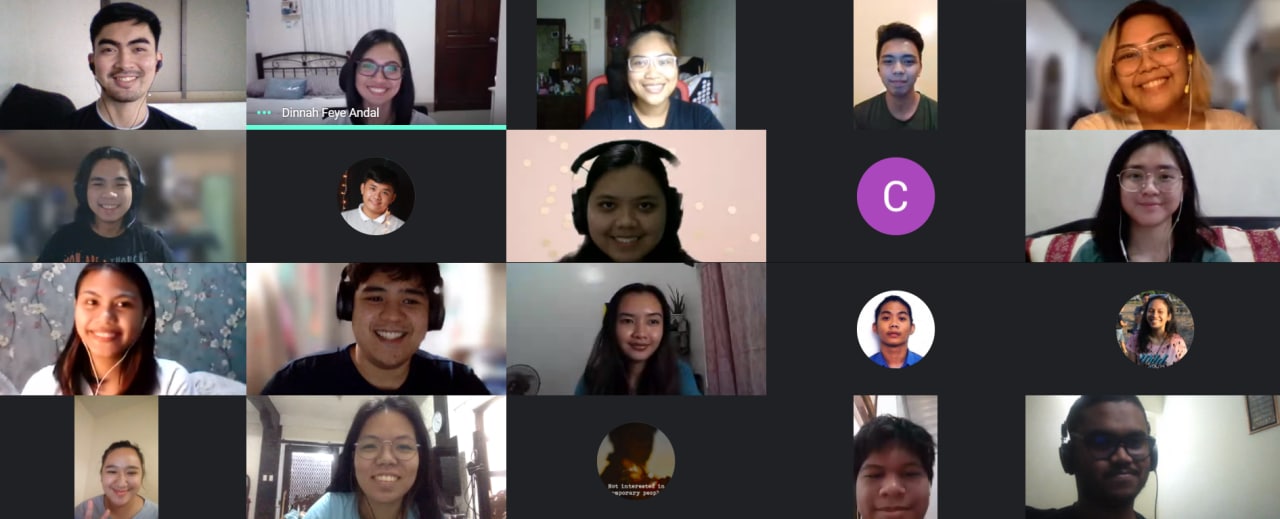
From this activity, we were able to add and validate a total of 2,146 buildings. We are hoping to add more and validate more data in the coming months!
I am also happy to share with you that University of Makati - Computer Society is the 5th local YouthMappers chapter in the Philippines! I am aiming to recruit more organizations to join the OSM community and YouthMappers network from Visayas and Mindanao islands in PH.

Currently Focusing my efforts on filling in information for the Area around Bethalto and Wood River, adding buildings and adding land use
Posted by pedrito1414 on 2 March 2021 in English.

We (community working group) have been compiling a list of OSM-related events inspired by International Women’s Day / Month or the 2021 theme #ChooseToChallenge.
Find them on the wiki here!
Please add any that we have missed!
Posted by Rabin Ojha on 2 March 2021 in English.
Last updated on 3 March 2021.

I have recently written a 5-minute summary on OSM related activities that happened in Nepal over the period of 2020. Please feel free to go through the blog and provide your valuable feedback and suggestions! Crossposting from Medium
Posted by Rabin Ojha on 2 March 2021 in English.
Last updated on 14 September 2022.
In 2020, I made at least one edit a day for 332 days. You can see the screenshot of my HDYC profile on March 2, 2021. During the year, I mostly mapped buildings, roads, and landuse around Nepal and Afghanistan.
I have an ambitious goal of making at least one edit per day in 2021. Let’s see how far can I go!!
Posted by c tito young on 2 March 2021 in English.
Last updated on 17 April 2021.
Shown are two straight geoglyph lines in perpendicular form a geoglyph 80m (oriented east / west) and 50m (oriented north / south) a fractions of a degree greater than a perfect right angle. Rarely seen are geoglyph samples of Nazca lines display anything resembling right angles. These two line proves to be obtuse in geometry measuring 90.9+/- degrees. Within the perpendicular area of those two lines are two other lines that resemble the letter V. They are significantly smaller in size being about 20m max all drawn on fairly flat land.
14°39′23″S, 75°18′3″W -14.6563906, -75.3007687 Changuillo, Province of Nasca, Ica, Peru
Bing Aerial Refresh
In fall of last year the Bing aerial imagery of Springfield, IL was refreshed, finally fixing a huge north/south tear down the middle of the city that had made adding accurate geometry within it nearly impossible. The new imagery is from that summer and is absolutely fantastic. It even covers outlying towns like Chatham, Rochester, Riverton, and Spaulding. I’ve been hard at work fixing alignment problems and adding new roads and buildings that I had heard about but hadn’t had a chance to survey. This and the pandemic are largely responsible for taking me over 270 mapping days last year, a personal best.
Accessibility
I’m not really hardcore about adding individual parking spaces, but when I saw the iD preset for accessible parking spaces I knew it was something I could and should add whenever possible. As a result, over 5,400 accessible parking spaces in the Springfield metro area are now mapped, accounting for more than half of those mapped in the United States as of this post.
I’ve been pretty good about denoting accessible crosswalks, even those with tactile pavement, but I definitely need to do another pass through some neighborhoods now that the imagery has been updated. The city does have a rather robust sidewalk/crosswalk improvement program and there are probably dozens of walkways that have been upgraded since I last mapped them all. Additionally, I’d like to be more fastidious about adding entrances to buildings/businesses so that distances can be determined between them and their associated accessible parking spaces.
Roadway Detail
For the longest time I was hesitant to delve into adding lane information for segments of roads, because… well, I just didn’t like the idea of splitting roads into a bunch of different segments. I thought it would make it more tedious to update speed limits and things like that going forward.
Posted by c tito young on 2 March 2021 in English.
Last updated on 11 April 2021.
In an area of about 600m long and 400m wide, hairpin geoglyphs mark the landscape. Multiple lines possibly added up over 10,000m are characterized by successions of hairpin turns on the flat valley floor. The lines appear in a straight north / east to south / west direction and result in distances approximately 3m from one another and terminates into a 180 hairpin turn curves repeating itself multiple times. Erosion has erased some of the hairpins and possibly details.
To the north of the site, is what appears as a large 110m x 100m viewing / gathering area atop a hill. The entire site except for the viewing areas appear rather flat with a gentle slope.
14°35′20″S, 75°18′12″W -14.5889989, -75.3034115 Santa Cruz, Province of Palpa, Ica, Peru
Posted by c tito young on 2 March 2021 in English.
Last updated on 15 April 2021.
A geoglyph of a 100m figure with an elongated head (25m x 50m) wearing a hat and scarf, oriented north to south on a change of elevation of 10m. This geoglyph shows this front facing elongated head. The large scarf and short brim hat worn by the figure is positioned in a way that suggests its resting on a rock facing the southwest direction.
14°53′20″S, 74°53′49″W -14.8889740, -74.8969612 Vista Alegre, Province of Nasca, Ica, Peru
Posted by grizzlysmit on 1 March 2021 in English.

correcting open street map is hard: someone put my units inside 1 Arrilla ave; but we a in 76-84 Karne street north how do you select multiple buildings still trying to work it out.

Outdoor seating has become more important than ever in times of pandemic - but I noticed recently that places that people can sit and drink a coffee or read a book on a bench or at a table are not mapped in my neighborhood in Seattle. Lots of restaurants have co-opted sidewalks and even parking spaces (this would have been very controversial a year ago!) for use by their customers, but I’m more interested in street seating that can be used by anyone.
Everything I’ve mapped so far falls under the category of “Parklet” - it’s a permitted structure usually built by, but not exclusively for, nearby businesses. There are some charming ones around town, see pics here and here!
I noticed today there is a tag leisure=parklet, used infrequently and almost exclusively in San Francisco. Instead I’ve been using leisure=outdoor_seating in combination with access=yes, as this seems to capture identical information, albeit without reference to the parklet movement. So far I’ve only found one of the places digitized as something else - the parklet outside Cortona Cafe is tagged leisure=park. This is misleading, it’s a seating area between the sidewalk and the asphalt. Here it is on the website of a local political candidate
So far I’ve been capturing these as points, mostly out of laziness, but I should go back and digitize the tiny polygons, or if there is a polygon, remove tags like leisure=park. I’m undecided as to whether I should tag them as both leisure=parklet AND leisure=outdoor_seating at that point?
I’m also not naming these parklets, as most are referred to either with the name of the sponsoring cafe, or the nearby intersection, and I don’t know that need this info, except maybe for Nominatum?
Please feel free to weigh in on this endeavor :-).

This post is a followup to yesterday’s maps of OSMF 2021 Survey results. We looked at demographics of survey respondents and their feedback to the board on 2020 actions like establishing new committees and fundraising.
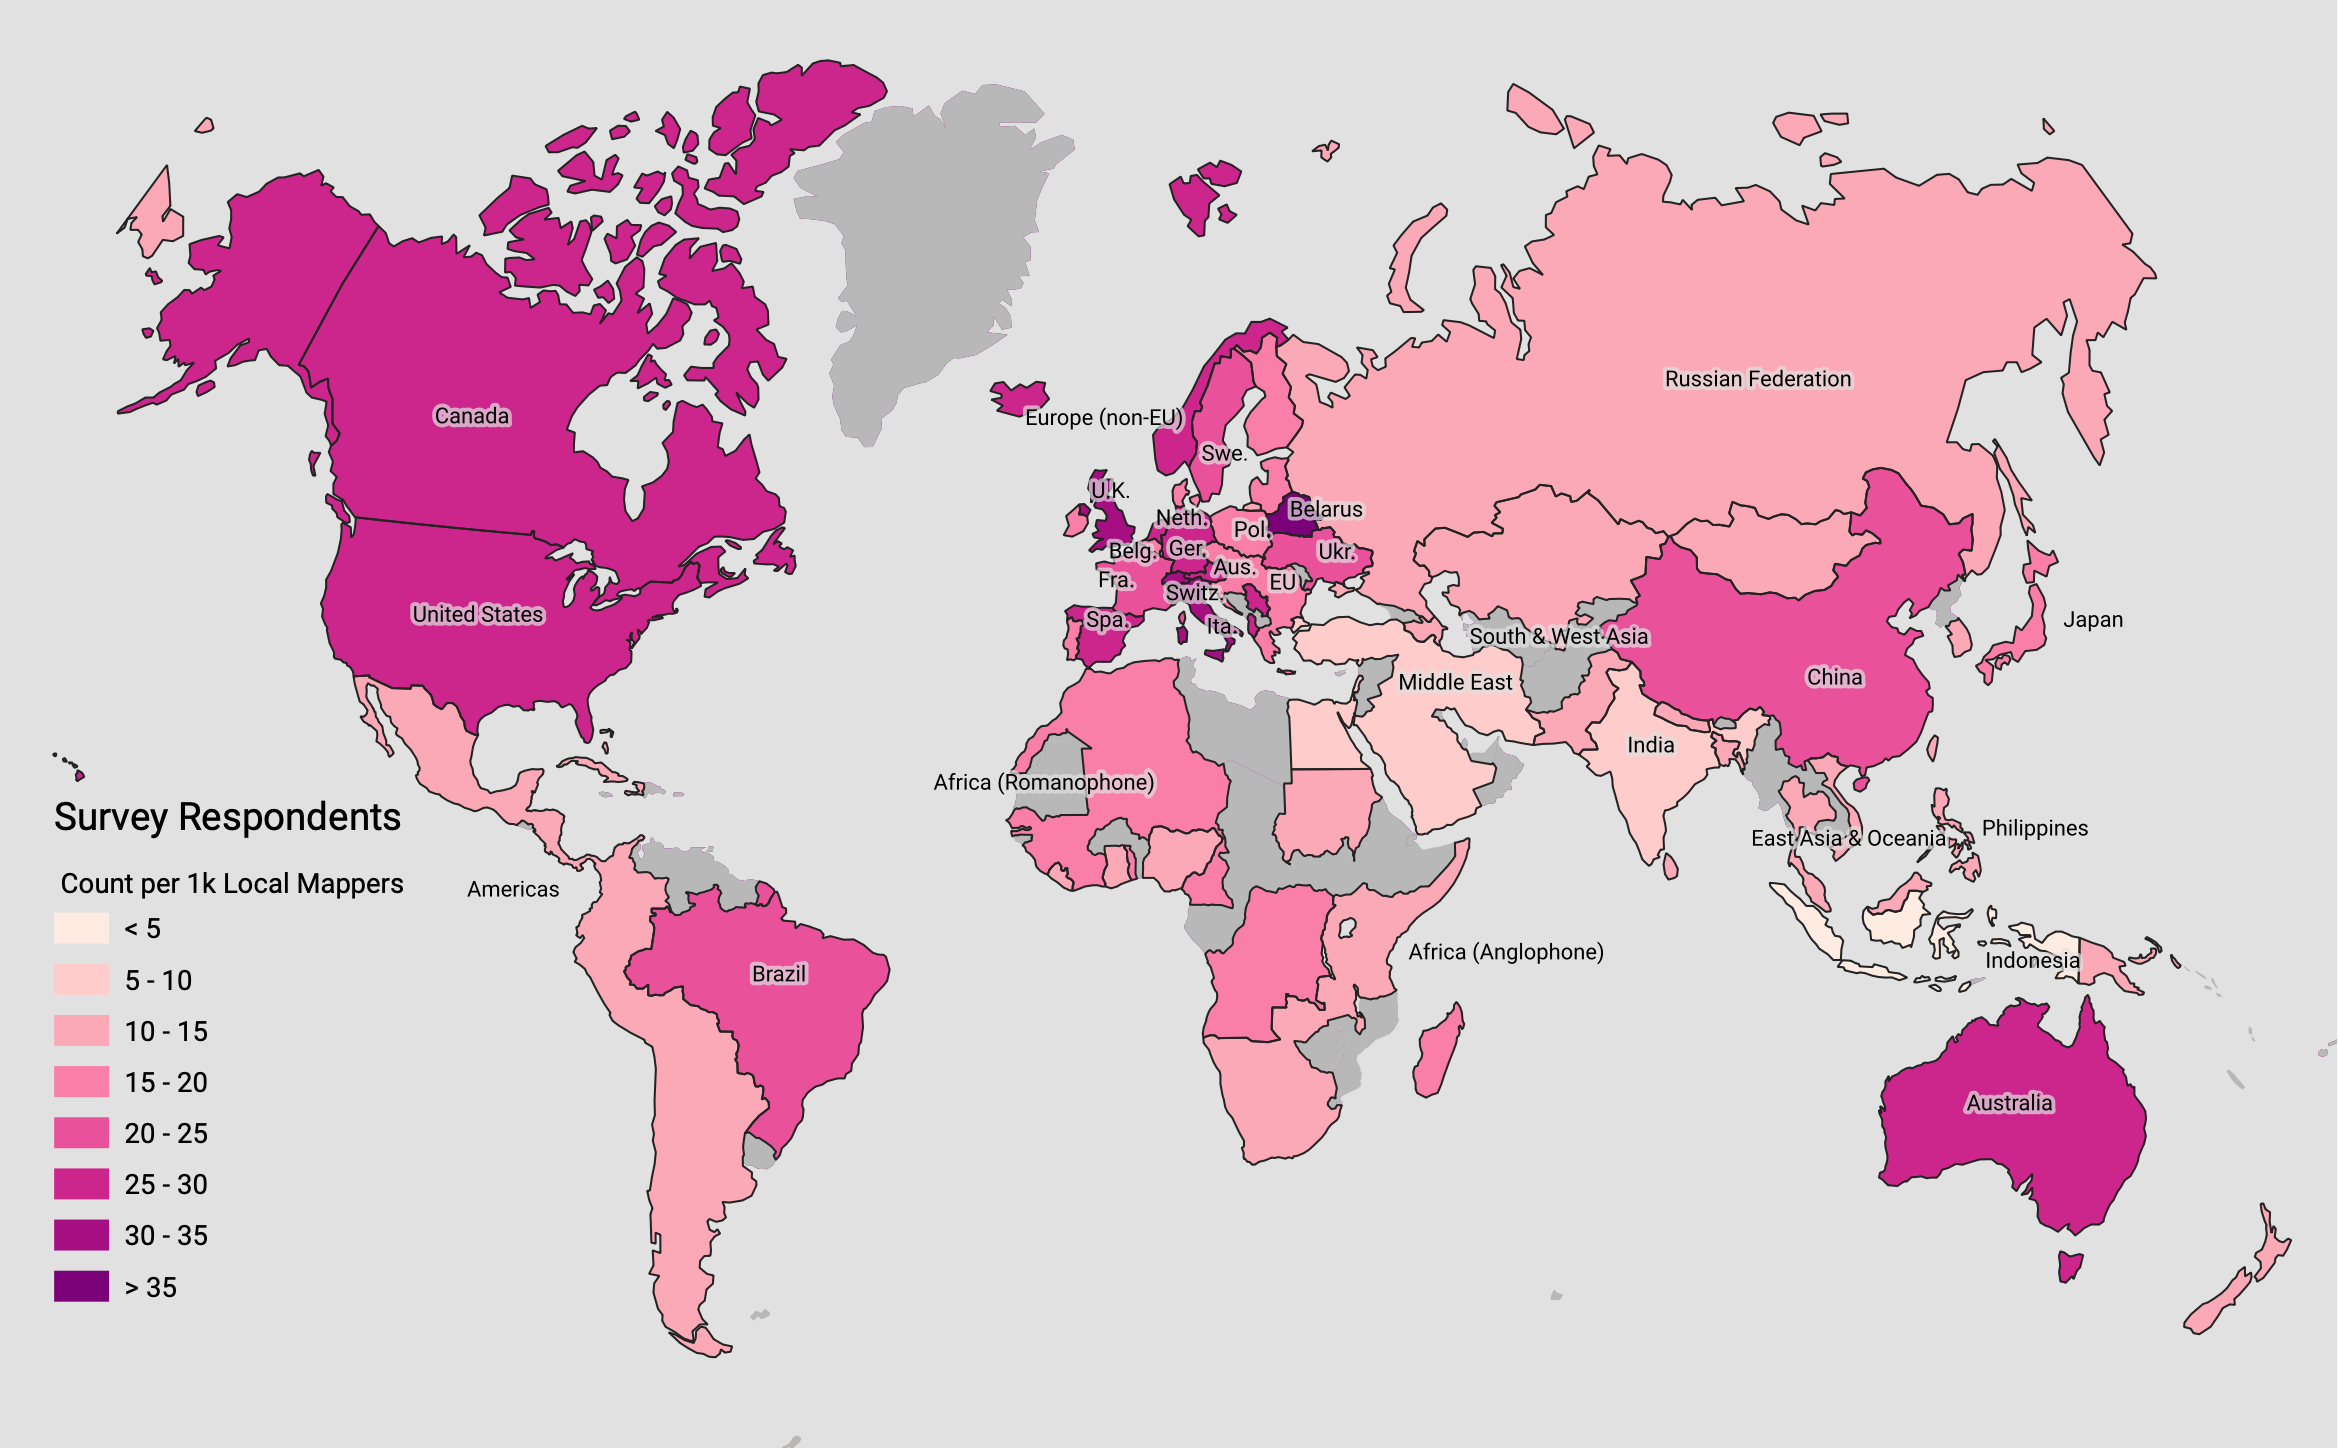
I’ll start with a recap of survey respondents vs. the general editing population of OSM. Jennings Anderson also posted yesterday with a view of worldwide mapping behavior and a simple methodology for determining who’s a local mapper for each survey region. This first map shows the number of survey respondents per 1k local OSM mappers, ranging from fewer than 10 in Indonesia and the Middle East to 35+ in Belarus: