Diary Entries in English

Recent diary entries

Posted by MyTopTechs on 3 November 2017 in English.

Open Street Maps for emergency services.

One of the issues to be dealt with during a tragedy is mapping information. When you setup emergency shelters, or if you are setting up mobile command centers it is important to share that information with everyone so everyone knows where resources are located.

I think that OSM can fill that gap for real time mapping updates for a changing situation.

Wondering what everyone else might think about that as well.

After the new law of 2014 for the administrative boundary it was a lot of work to split the border line to the new one.

A good help was this source:

It was checked/added/updated the nomination (name), boundary line, zipcode, population, wikidata, wikipedia!

Posted by ypid on 2 November 2017 in English.

We are pretty close to overcome the 1M (mega) count of opening_hours values in OSM. Also the amount of values which are machine readable is increasing from day to day. Almost all of those 1M values (97.8 %) follow the specification which greatly extends the use case of opening hours.

Thanks to all of you! 10 million is not far now :)

Ref: http://openingh.openstreetmap.de/stats/

Posted by ChristianA on 2 November 2017 in English.

I’ve been busy lately and haven’t had time for much OSM mapping. But yesterday I went on a mt bike trip. I had planned the route so that I could check out some old quarries and a couple of possible paths as well.

The temperature was a couple of degrees above 0, but there was still ice on the small pools of water on the trail. Sometimes the ice was so thick that the bike would not simply go through but first skid on the ice and then go through. It was also very muddy and wet, so the biking conditions were quite tough. But if you go mtb-biking in Sweden in november, these conditions are pretty normal.

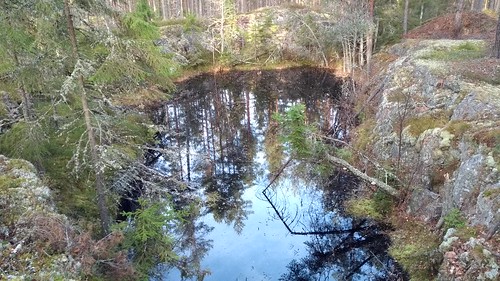
The first quarry had not been used for some time, but it was quite easy to find. It was used for stone material, not any metal extraction. Stora Mossen

See full entry

Location: 58.705, 16.250
Posted by skonate on 1 November 2017 in English.

We are pleased to announce the International Federation of Red Cross and Red Crescent Societies is joining the Missing Maps Partnership. Missing Maps is an open, collaborative project in which you can help to map areas where humanitarian organisations are trying to meet the needs of vulnerable people – creating open data that can be used for planning, awareness, and analysis. Over 33,000 people have contributed 33 million edits to OpenStreetMap since Missing Maps was founded in 2014. These contributions have been used to support health interventions, emergency response and resilience programs. Volunteers, organizations, and humanitarians collaborate in a number of ways: remote mapping, field mapping and humanitarian activities.

See full entry

Posted by Skippern on 1 November 2017 in English.

You can definitely say things have happened since previous post.

Currently I am working in Kuwait, on something that will be one of the largest oil refineries when opened. Almost daily driving between this project construction site, and the corporate apartment I have been given in Salmiya, almost 100km away. Kuwait is quite good mapped, but there are construction work on several locations, so the map will need a series of updates and corrections in the near future.

Further I have also taken an active role in preparing GTFS data for bus routes in Greater Vitoria area, and together with the osm2gtfs team have assisted in improving the data model of that project, so it will not be too challenging to create a data scraper and use OSM data to create a valid GTFS data file usable in public transport routing apps.

In addition to this, my gpxupload project have received a complete rewrite, and with a little more attention will be ready for release of v2.0. The script have become 10x faster, and much easier to maintain. It will also start using configuration files, so that options that should be user configurable no longer are hardcoded into the script.

I also have a server in construction, due to the project in Kuwait, I do not have direct access to it, and several of the services are still not in place, but upon completion here I will have the server completed. The server will not be placed online, so it will only run personal services, but will allow me to crontab several tasks I run manually now, and test out a lot of stuff I want to work with, as well as freeing up a lot of disk from my notebook computer.

Planned services for the server:

See full entry

Location: Az Zour - Sulah, Ahmadi Governorate, Kuwait

Texte alternatif The Global Partnership for Suitable Development Data (GPSDD) announced one of the biggest initiatives to support collaborative data innovations. 400 applications were summited and after a very close decision, 10 projects will be piloted with the support of the World’s Bank Trust Fund for Statistical Capacity Building (TFSCB). All ten proposals have a strong background in data production, dissemination and use, most of them aiming to try their approaches in low and middle-income countries across Africa, the Middle East and Asia.

The diversity of selected projects covers all kind of innovations, water level monitoring and alert using telecommunication networks, utilising satellite waves to detect illegal fishing and counter human traffic, improving vital registration for Syrian refugees in Lebanon, predictive machine learning methodology to help aid workers foresee patients’ behaviour, etc. Read the complete list here.

See full entry

Posted by skonate on 31 October 2017 in English. Last updated on 1 November 2017.

[ed. note: Data @ IFRC is a blog series to share highlights from the Red Cross Red Crescent Secretariat and National Societies. We will include learning opportunities and thought pieces on all things data from ethics to evidence.] Texte alternatif Maps have always been storytelling devices. And, the art of mapmaking is a community-building exercise. Missing Maps and YouthMappers are two programs which provide unique ways to connect humanitarian work to mapmaking. YouthMappers, with university chapters around the world, connects humanitarian mapping needs to education programs. Their main target group is university-level geography (GIS) students. Missing Maps is both a global and local program that supports mapathons around the world. Inspired by both concepts, data scientists Heather Leson and Guido Pizzini co-hosted a Missing Map event for youth at Ecole Internationale Geneva. See below the complete narration;
Read more…

Posted by 13 digits on 31 October 2017 in English.

Maybe I think creating a new map style is quite easy for someone who is experienced with coding new styles. To be honest I really do not know the amount of work nor if you need server to render a new map style. Since quite a time I am looking for a map style that shows only buildings which are ilustrated in black. Not more, not less. No streets, no water bodies, no green areas. In architecture its called ground map (in german: Schwarzplan) and should give you a better visualisation of the structure of a town. Due to these structures it gives you also a reference of the historical development of a city. The often refered website (www.der-geograph.de) is a good posibility to render areas with the above mentioned style. My question to the OSM-Community is if it is not possible to create a map style which makes it obsolete to render areas tile by tile which takes ages like on that website.

Posted by baditaflorin on 31 October 2017 in English. Last updated on 1 November 2017.

Obviously but very importantly:

  • Before copying anything into OSM the license needs to be properly vetted.
  • If you are planning to perform any kind of bulk update, the full extent of the Import Guidelines applies.

After comparing Tiger 2017 for 16 US states until now, using shp2cygnus, a tool that I written at Telenav to be able to compare big datasets in a automatic way, to identify roads that are present in the dataset, but not in OSM

After posting on the talk-us, some people told that it would be more useful to run this tool on other datasets, from state or local authorities.

In this article, I want to teach you how to create your own translation file, so that if you have a shp file, you can use Cygnus to compare this with OSM, using this link http://cygnus.improve-osm.org If you have a shp were the size is bigger then 50*50 km, you can send me a email and I can process it for you.

But you need to learn how to create your own translation file.

So, first step.

  1. Find your data

See full entry

Posted by SomeoneElse on 30 October 2017 in English. Last updated on 1 February 2018.

It’s been possible to run Linux software on Windows for some time using Microsoft’s “Windows Subsystem for Linux”. Here’s what needs to be done to run a simple tile server there, based on the existing instructions here .

Firstly, install “Bash on Ubuntu on Windows”. There’s are some intructions here (but don’t worry where that says “This won’t work with server software”). Continue down to where it says “You’ll be asked to create a user account and password for use in the Bash environment”. It’s easiest if that user account is the one that you use in the rest of the switch2osm instructions.

Once installed, at a shell prompt “lsb_release -a” should say:

No LSB modules are available.
Distributor ID: Ubuntu
Description:    Ubuntu 16.04.3 LTS
Release:        16.04
Codename:       xenial

What you get is surprisingly similar to a standard Ubuntu server machine. Some things don’t work (e.g. “screen”), and you’ll have to manually start some of the services that will need, but otherwise things are very familiar.

Run “sudo apt update” and “sudo apt upgrade” to upgrade to the latest version of everything.

Next, go over to the switch2osm instructions and follow those as normal, except for the caveats pointed out below:

If you want to ssh in (you probably will) you’ll need to “sudo service ssh start”.

You’ll likely want to allow access to ports 22 (for ssh) and 80 (for http) and possibly others at the Windows Firewall (inbound rules / new rule / port / tcp port 80 / allow / all / “name”).

After installing postgresql but before doing e.g. “createuser renderaccount” you’ll need to start postgresql manually. “sudo service postgresql status” will say “down”, but after “sudo service postgresql start” it will say “Starting PostgreSQL 9.5 database server” and “service postgresql status” will then say “9.5/main (port 5432): online”.

See full entry

It was a great opening to make a relationship with Eastern University of Sri Lanka in Batticaloa that I could able to manage two days OSM training for the students. Lecturers and students were appreciated and looking forward to hear more training in future.

Department of Geography, Eastern University of Sri Lanka has requested to me to do more activities on OSM and they are ready to contribute to develop OSM map in Sri Lanka.

Group Photo on 27th of October 2017

Location: Chenkaladi, Batticaloa District, Eastern Province, 30300, Sri Lanka
Posted by MerrynW on 28 October 2017 in English.

Ordnance Survey is great, but it’s not fast. Ordnance Survey’s Mastermap isn’t updated regularly enough to have captured the extension to my house, constructed two years ago. Hopefully, one day, the local planning authorities will find a way to connect their new construction sign-offs to those updates - a kind of bricks-and-mortar blockchain. For now though, if Mastermap isn’t going to put the right polygon in place, then I’ll have to learn how to do it with OSM. Perhaps the really neat and tidy areas of the UK OSM correlate to the hometowns of GI-related employees?

I have been seeing new Bing imagery show up in Michigan in areas I edit. Although updated imagery is welcome, I would say my subjective view of its quality makes it a mixed situation. Subjectively I would describe it as more blurry or less distinct. Maybe the new imagery has lower contrast.

The problem I see most is with creating new or recreating existing imagery offsets in JOSM. I have created and uploaded many by using survey marks or benchmarks with known coordinates. An example that is no longer visible is at N 42 55 06.65005 W 084 32 34.97447. Contrast that with the Mapbox or Ersi World imagery where the concrete circular base is visible along with witness post just to the west.

I have started to add offsets for Ersi World which seems to have more distinct imagery. For the few offsets that I had added I have been quite pleased to see how close Ersi World was to begin with. Most have been within a meter accuracy.

Posted by escada on 27 October 2017 in English.

Most links point to websites written in Dutch

Last summer I noticed that Tourisme Pajottenland was using an OpenStreetMap-based map to promote a walk they organised together with Pasar. Unfortunately, the attribution was missing. So I contacted them asking them to add it and proposed to come over to explain OpenStreetMap to them.

I got a very positive reply back and the following maps with walks all got the attribution. And I was invited to discuss a possible collaboration. This meeting was in the first week of October.

Before I describe the meeting and their needs, I will try to explain how their organisation works.

I actually met the people from Regional Landscape P & Valley of the Zenne. This is one of the 17 regional landscape organisations in Flanders. Flanders is the Northern part of Belgium, where people speak Dutch. Together, those 17 regional landscapes cover most of Flanders. They all work around the same topics:

  • Landscape: they work together with local governments, civilians and other organisations to improve the environment. They give advice to landscape gardens and fields with local trees and hedges.
  • Nature: they set up projects to protect fauna and flora
  • Education: they organise workshop, courses and activities related to nature and landscape
  • Recreation: They promote recreation with respect for nature, maintain slow roads and set out signposted walks.

Perhaps this is better explained on the website of Regional Landscape Rivierenland (in English).

Besides those regional landscapes, we also have organisations in which villages work together on heritage. They are called “intergemeentelijke onroerenderfgoeddienst” (IOED). More information can be found on the website of the Flemish agency for heritage.

There is one of those IOEDs that work together with the regional landscape Pajottenland-Zennevallei: it’s called Erfgoedcell Pajottenland-Zennevallei.

See full entry

Location: Gaasbeek, Lennik, Halle-Vilvoorde, Flemish Brabant, Flanders, Belgium
Posted by ika-chan! on 27 October 2017 in English.

Source: http://www.bbc.co.uk/news/world-europe-41780116

The Catalan regional parliament has voted to declare independence from Spain, in a vote that was boycotted by opposition MPs. Spain currently disputes the independence bid, and the EU considers it a domestic issue not worth butting into … yet.

I have thus identified a potential border issue in OpenStreetMap that should be resolved before it gets out of hand.

How should we approach this?