Diary Entries in English

Recent diary entries

As I had mentioned in my last post where I explain what they are, I had long planned to make a video about mapping historic lifting stones. It took a while to get to sites and some footage etc and to figure out how to map them best, at least in my opinion, but the video is now online on Youtube. I’ve added subtitles in English, German, Irish, Basque, Finnish, Icelandic and Welsh, because these are to my knowledge the countries where the tradition is still upheld or has been revived. For everything but German, I used the auto-translate function, but YouTube tends to not know the correct word for “lifting stone” in the respective languages, so if anyone can correct me on the subtitles, I’d be grateful. For the same reason, I did not translate the title of the videos into most of these languages, and also because I didn’t want to give the impression that it was completely available in these languages. It is possible now, I think, to have the audio generated in other languages, but that is too creepy to me. As curious as I am to hear myself speak fluent Welsh, I’ll give it a pass.

I’m hoping to do another shorter video about mapping them using OSMAnd, but I need to get to a site of an unmapped stone first which is easier said than done, considering I don’t drive and there are not that many unmapped ones near me. The sites in the current video were accessible by public transport, walking and cycling, so it’s a very sustainable video in its production.

I’ve also done a bit more work on the English wiki page for historic=lifting_stone, translated it into German and written a wiki page for leisure=lifting_stone. The latter is for the newly placed stones and the historic ones that are being lifted again.

I would appreciate if people capable of the above languages could translate the wiki pages into those languages to get a wider coverage of them being mapped.


Lire en françaisLeia em portuguêsPDF download in English


IVIDES DATA® support the training of new mappers in Cameroon and reaffirms its commitment to expanding knowledge about OpenStreetMap to countries overseas


See full entry

Location: Centre Commercial, Yaoundé I, Yaoundé, Mfoundi, Centre, Cameroon

I’ve been working recently on a personal project to investigate how much of the Overpass query language could be implemented using a different back end database, namely the QLever database.

Overpass is the most widely used public interface for querying OSM data. It is relatively easy to use and understand and its outputs in GeoJSON or OSM XML are readily integrated into OSM or other geospatial tool chains for visualization or other processing.

But Overpass is somewhat of a victim of its success. Demand for the public Overpass service has recently outpaced server capacity. My earlier work on a container image for Overpass was intended to help scale capacity by making it easier for data consumers to run their own local Overpass servers.

This project looks in a different direction. What if the Overpass QL with its ease of use and its integration into other tools were available on top of a different data source?

QLever

QLever is a SPARQL database developed by the Chair for Algorithms and Data Structures at the University of Freiburg. SPARQL is an RDF query language where the data are represented as “triples” of a subject, predicate, and object.

QLever represents geospatial data as WKT and can perform geospatial operations on WKT. The osm2rdf conversion generates WKT data for every OSM element. So, the data in QLever stores the complete geometry from OSM.

But the key to QLever’s performance with OSM data is that in the conversion from OSM PBF to TTL (Terse RDF Triple Language), osm2rdf generates triples for every element to describe their spatial relations with other elements. That is, osm2rdf pre-computes the spatial relations sfIntersects, sfContains, sfCovers, sfTouches, sfCrosses, sfOverlaps, and sfEquals between all OSM elements.

See full entry

Posted by AriAlvarez on 7 June 2026 in English. Last updated on 11 June 2026.

This is a personal note so I remember the settings to use depending on my method of transportation:

Bicycle:

  • Mode: 360 Timelapse Video
  • Interval: 0.5 seconds
  • Resolution: 5.6k
  • Enable HyperSmooth if possible
  • EV compensation: +0.5
  • ISO: 100 Min, 200 Max
  • Color Profile: Flat
  • Remember to point one camera to the right, the other to the left. Maximizes aerodynamics and captures better quality images of signs.

  • ALSO, try 360 Timelapse Photo. I received way too much pixelation using timelapse Video, so I need to experiment with timelapse photo. Photos will always look better than photos which were extracted from video.

Walking:

  • Mode: 360 Time Lapse Photo
  • Resolution: Max
  • Interval: 2 seconds
  • Enable HyperSmooth if possible
  • EV compensation: +0.5
  • Color Profile: Flat
  • ISO: 100 Min, 200 Max
  • If photos appear too clustered, increase time of interval

Car Interior:

  • Mode: Standard Video
  • Resolution: Max
  • Frame rate 30 fps for forward view
  • Frame rate 60 fps for side view (to reduce motion blur)
  • Field of view: Linear for side shots, Wide for more vertical coverage. Never use SuperView
  • Horizon Leveling: Off
  • Enable HyperSmooth if possible
  • EV compensation: +0.5
  • Color Profile: Flat
  • ISO: 100 Min, 200 Max
  • For side shots, best to angle 45 degrees for best of both worlds.

Car Exterior:

  • Mode: 360 Video (continuous)
  • Frame rate: 24 or 30, need to play around with it
  • ISO: Min 100, Max 200
  • EV Compensation: +0.5
  • Color Profile: Flat
  • Shutter Speed: Auto

ISO above 200 causes picture clarity problems. Remaining under 200 ensures that daylight photos are clearer and signs can be read better. Leaving the Color Profile Flat preserves maximum detail in shadows. None of the images might be appealing to the eye, but they will be very good for mapping purposes

Posted by aleesteele on 6 June 2026 in English.

Hi folks! I’m up for election to HOT’s voting membership this year (thank you, Pete!). As a part of that process, I’m posting my answers to their prompting questions here on my OSM diary.

I know that I already owe this community a summary of my previous research within the OpenStreetMap ecosystem – and what’s changed since then. By way of explanation and apology: I wanted to flag that I will be giving a talk at this year’s State of the Map in Paris with an update on my previous work. You can see the talk I gave in 2022 here. I also gave a talk at the HOT Summit in 2021.

I also want to flag that no LLMs were used in the writing of these answers: while I do use them sometimes for more functional, repetitive, or iterative work, I did not use them below. Writing is often a form of thinking for me, and for these answers, I wanted to prioritize that process.

What does HOT mean to you?

In the last 6 or so years, HOT has both professionally and personally changed how I think about technology, community, and crises. It’s also meant different things at different times for me – which I wrote a bit more about in the question below.

In short: I’ve come to see HOT (and humanitarian mapping more broadly) as a kind of canary in the coal mine for the broader technology ecosystem at large. The questions I found here, at HOT and across OSM are ones that I have later found in the broader ecosystems they feed into (and even the world at large): questions about navigating permacrises, about AI, about shifts in funding landscapes, about ethical dilemmas for data pipelines, about cross-cultural community-building, and many, many others.

How did you become involved with HOT?

I have perhaps an unusual path to being involved with HOT: I was an anthropologist and ethnographer of the ecosystem of humanitarian mapping that HOT feeds into before becoming involved as a mapper and facilitator in the past few years.

See full entry

Ayubowan from Sri Lanka,

My name is Hasna from Sri Lanka, and I bring over 3.8 years of experience in OpenStreetMap (OSM) and humanitarian geospatial work. I began as a self-learner with limited engagement, but my journey has evolved into sustained, impact-driven contribution at both national and global levels.

In 2022, I joined UNOPS Sri Lanka, where I worked within capacity-building initiatives for civil society organizations. In this role, I actively promoted OpenStreetMap, open-source GIS, and humanitarian mapping through HOT. Through the UNOPS Vriddhi Project, I directly trained over 100 civil society partners, strengthening local mapping capacity and enabling wider adoption of geospatial tools in development work. This experience grounded my understanding of how open mapping translates into real-world community impact.

A defining milestone in my journey was attending State of the Map 2025 in Manila. This experience significantly reshaped my perspective on the global humanitarian mapping ecosystem. It allowed me to connect with experienced mappers, mentors, and contributors, and establish a strong professional network. Since then, my engagement with HOT has become more structured, consistent, and purpose-driven.

Currently, I serve as the Country Lead for Sri Lanka under WOM Asia Navigators, where I support community engagement and capacity development in open mapping. Over the past seven months, I have completed more than 190 HOT tasks across disaster preparedness, disaster response, and recovery operations, demonstrating sustained technical contribution in humanitarian contexts.

What does HOT mean to you? HOT represents a global humanitarian ecosystem that transforms geospatial data into life-saving action. To me, it is not just a platform, but a collaborative force of mappers, organizations, and communities working to ensure that vulnerable populations are visible, supported, and included in disaster preparedness and response systems.

See full entry

Good day!

I’m Erika from the Philippines, an open mapping advocate and member of UPRI YouthMappers. I actively contribute to OpenStreetMap and humanitarian mapping initiatives that support disaster resilience, risk reduction, and community-based geospatial data. Alt text My journey with HOT began as a volunteer mapper through YouthMappers, participating in mapathons that create critical data for disaster-prone and vulnerable communities. Over time, I became a student leader in UPRI YouthMappers and later served as an Open Mapping Guru, helping train new mappers and support community programs within the HOT ecosystem. I also expanded my involvement in the broader open mapping community through local and international events such as Pista ng Mapa (Festival of Maps) and State of the Map. These experiences strengthened my appreciation for the power of collaboration, community building, and open geospatial data in addressing real-world challenges.

See full entry

Radio and communication towers made of wood are rare. Lists of such objects can be found on https://en.wikipedia.org/wiki/Cell_site#Wooden_structures , https://en.wikipedia.org/wiki/List_of_tallest_wooden_buildings_and_structures and https://en.wikipedia.org/wiki/Lattice_tower#Wooden_lattice_towers .

A possible further object may exist north of Kóspallag, Hungary at 47.8786466 N 18.9422987 E. However there are no pictures of this tower available. In the openstreetmap entries this object is classified as a hybrid structure of steel and wood, but Google Streetview shows it as a steel object, however it is barely visible there.

So someone should determine the exact type of this structure. It would be also a great idea, if someone could take a picture of this tower and upload it to Wikipedia, so everyone can see its type.

Further it would be great if Hungarian mappers can find out further wooden cellphone transmitters (past and present) in Hungary and add them to the list on https://en.wikipedia.org/wiki/Cell_site#Wooden_structures

Location: Királyrét, Szokolya, Szobi járás, Pest, Central Hungary, 2624, Hungary

I don’t normally think about the Sun’s direction when I go out running. When it gets exceptionally hot in summer, I start to notice it and wonder if I can tune my early morning run routes to experience slightly less heat. In principle, that should be possible. The position of the Sun can be worked out with a Python script. Combined with the angle of the Sun in the sky and your heading, it will tell you if you are running straight into the Sun or if the Sun is behind you. My personal preference is running towards the sunrise. After sunrise, you can call OSRM to optimize around solar load, defined as a function of Sun azimuth, your heading, and Sun altitude. This is probably over-engineering for route planning, though. The solar load has no simple formula, and the effect of clouds or humidity is hard to account for. Just a basic knowledge of civil dawn, sunrise time, and sunrise direction is probably enough for everyday running. But back to route generation — if you can find a metric to optimize for, you can generate new routes you have not run before. It is hard to define route novelty, but something like sun direction is easier to work with. The end goal would be to create routes that are different from what you can discover by simply using your street sense.

Location: Phường Tân Sơn, Thuận An, Ho Chi Minh City, 72100, Vietnam
Posted by m_fuhrmann on 4 June 2026 in English.

The Spieli

History and Motivation

From the very beginning of my OSM journey, I loved the idea of playground maps. There are several reasons for this, but I won’t go into detail here. For example: open data, maps, FOSS, and, of course, the children and their joy (and… all the parents out there will surely appreciate it when their children play at a playground - ideally with plenty of other kids 😉).

There were already some playground maps available. Some were based on OpenStreetMap data, others were not, or used a mix of both. Some looked like they were designed in the 90s, while others did not. In many cases, users were required to create an account with the maintainer’s service—or, even worse, with Google 🙈. Additionally, in these cases, photos, comments, reviews, and so on were stored in their systems, and OSM was only used as a map layer to display playgrounds in general.

See full entry

Location: Innenstadt, Fulda, Landkreis Fulda, Hesse, Germany

Leia em português

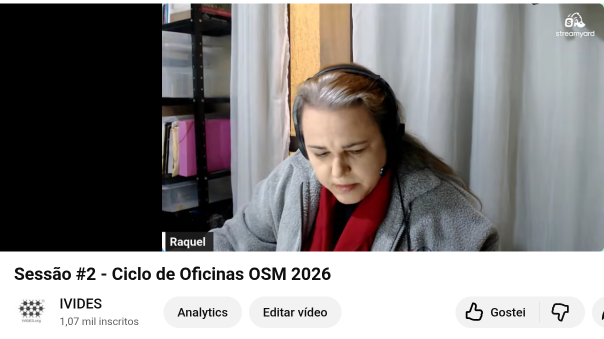
IVIDES DATA™ held the second session of its 2026 OpenStreetMap Workshop, focusing on OpenDroneMap, OpenAerialMap, and custom imagery in editors. Participants also learned about relations and creating multipolygons.

img1 Session 2 of the 2026 OpenStreetMap Workshop - Link


IVIDES DATA™ successfully held the second live session of the 2026 OpenStreetMap Workshop on May 22, 2026, during which the following topics were presented:


* Generating aerial imagery from drone photographs using OpenDroneMap (ODM);
* Uploading the image to OpenAerialMap (OAM) and retrieving the TMS geoservice URL;
* Resources for mapping with custom background images (GeoTIFF, via TMS geoservice) and street-level photographs (Mapillary, Panoramax);
* Overview of geoservice and image licensing and permission to use images on OpenStreetMap;
* Description of relations in OSM;
* Mapping simple areas and creating simple feature relationships (multipolygon type).


See full entry

Location: Recreio dos Bandeirantes, Rio de Janeiro, Southeast Region, Brazil
Posted by HuggeK on 2 June 2026 in English. Last updated on 6 June 2026.

We more experienced mappers realize fast that OSM Carto is just meant to show off the capabilities of the database. So many takes I have seen “I did it becuase if I did it another way (which would be the conceptual better way, also documented on the wiki) it wouldn´t show up on https://www.openstreetmap.org…”

I am launching

As an open source project to first generate golf-centric PMtiles to help the mapping and application who wants to display world wide coursemaps. Then move on to at least daily updates to help mappers.

Help wanted if you want to try it out!

iD tagging schema is a recording of various information about OpenStreetMap tagging. It is done in format allowing it to be both machine-readable and human-readable.

There are various ways how it can be improved, some relatively complex, some very easy.

We have list of things that should be fairly easy to implement

If anyone is interested in contributing - it could be a good start and I can promise quick review, if they would be implemented by someone.

This changes will be quite easy to write, it is not a programming - it is rather editing a relatively simple config file. But they still need to be tested, which actually takes most of the time. And if editing config file is not a very scary task and https://en.wikipedia.org/wiki/JSON#Syntax is not terrifying, then you have a good chance to be able to do it.

Review afterwards should be quick like for another group of simple tasks

If you would be interested in helping with iD tagging schema, and you have any amount of technical ability… But this supposedly simple tasks are not obvious, feel free to ask here for help and I can guide you to your first PR.

Even if you never did anything with git/github etc, this could be a good start. And maybe you would later implement a more complex task

Hello OpenStreetMap community,

My name is Micheal Kaluba (OSM username: Michea Kal), and I am honored to be nominated for voting membership in the Humanitarian OpenStreetMap Team (HOT).

My journey with HOT began around 2016 through the Malaria Elimination Project and continued through my work with OpenStreetMap Uganda, where I served as a Field Mapping and GIS Training Associate for about six years. I currently serve as the Executive Director of Wikimedia Community User Group Uganda.

Over the years, I have been involved in mapping, field data collection, project management, capacity building, and community development initiatives across Uganda and South Sudan. Through collaborations with OpenStreetMap Uganda, Wikimedia Uganda, and other partners, I have contributed to humanitarian mapping projects, community training, and open data initiatives.

I have also participated in several international mapping conferences and community events, including State of the Map conferences in Germany, Côte d’Ivoire, Tanzania, the United States, and Kenya. These experiences have strengthened my commitment to open mapping, local leadership, and community-driven development.

To me, HOT represents the power of volunteers, communities, and organizations working together to make geographic information accessible where it is needed most. I believe in HOT’s mission and would like to contribute more actively to its governance and future direction as a voting member.

As a voting member, I hope to support inclusive decision-making, accountability, and stronger representation of communities from underrepresented regions. I also look forward to contributing to community and training initiatives within HOT.

See full entry

Posted by ScarlettB on 1 June 2026 in English. Last updated on 2 June 2026.

This is a summary of the problem and a proposal regarding inconsistent treatment of greenery in sidlisko areas in Bratislava, Slovakia. Some arguments stem from my own experience with mapping these, some echo those I saw in various changeset comments. The following text is likely not exhaustive and I invite anyone concerned with the matter or area in question to join in discussion.

The subject

Greenery areas around blocks of flats on Bratislava’s sidlisko areas are specific. They’re typically grass, but often also with trees, benches, bins and play structures within them, all of it somewhat regularly maintained. I’ll call these areas panelak greenery for the remainder of this text.

The motivation

I began micromapping Karlova Ves and simply found that when adding detail up to splitting landuse on roads, using leisure=park becomes problematic. While leaving it mapped as huge blobs of leisure=park is an option, it’s a very rough approximation which doesn’t describe these areas in detail, which then defies the point of micromapping.

 The problem

The subject as described above implies usage identical to that of a park, and indeed, leads one to consider that leisure=park is technically the right tag for such areas. It is also apparent that these areas are not parks in the traditional sense of being compact areas dedicated to leisure and intended for the wide public. Since this is a bit of an instinctive classification, I’ll try to break it down into particularities. What differentiates these areas from parks follows:

See full entry

Location: Rovnice, Bratislava, District of Bratislava IV, Bratislava, Region of Bratislava, 841 04, Slovakia

Hello,

Below I have compiled recent news related to the OSM Foundation (OSMF) board’s work. Most of these are or are going to be publicly documented on the OSMF website, so if you follow the Atom feed for the board meetings’ page, you can skip this.

What this diary entry is

It contains my personal selection and recollection of recent OSMF board-related updates.

What this diary entry is not

It is not intended to include details or all OSMF board-related updates. For these, you can refer to the published board minutes. This entry has not been reviewed by the OSMF board.

Why?

Informing the OSMF members is important. The board minutes describe in detail what was discussed in public board meetings, but many people don’t have time or follow the Atom feed for the OSMF’s website recent changes. At some point, I was creating annual or more frequent updates for the whole Foundation, which was a lot of work during a short period, while other tasks were ongoing.

I’m posting this experimentally, and I’m going to see whether I can continue to do so semi-regularly.


May 2026 OSMF board updates

The board had a meeting on Thursday, 28 May 2026.

Draft minutes are here and they include minutes of the Chairperson’s report by Craig Allan and the Secretary’s report by Dani Waltersdorfer.

Some highlights are below.

Disputed territories

Rewriting the information for officials and diplomats of countries and entities with disputed territories
Craig Allan (OSMF Chair) has drafted a revision of the document for officials and diplomats of countries and entities with disputed territories, which was approved in September 2013, and which is referred to by the Data Working Group (DWG) and the OSMF. Craig circulated the draft to the board for feedback and suggested to Simon Poole (former OSMF Chair, former LWG Chair and present during the May 2026 board meeting) to review the updated policy document.

OSM data licensing

See full entry

I came to know about this brilliant piece of software about a year ago. This has made me feel fresh, and happy. At first I was just roaming around the world, seeing different things like roads, buildings, parks etc.. They felt very different from google maps, because they were highly detailed. With information such as road lanes, speed limits, road surface, type, who made it, when was it made, when was renovated and stuff. I found a goldmine of data, but for maps). Then I saw my area. Well, I was really disappointed that nothing was there except the main road. Literally not even the names of the villages. Comparing to other countries it was nothing,like comparing a super-car with crying baby! My heart was demolished. So, I decided to make my area great in OSM.

But here is a twist, Whatever you think I added 1st is not true. The 1st thing I added was the Transmission line. IDK why I added it fist, but after that I added a lot of things like, Roads, Streets, parks, Trees, local power distribution lines and poles, with sewage line, the pond, also added businesses, corrected road names, resolved 2 to 4 year old messages. And now my village is the most detailed village in my district until someone else decides to map his area.

Before ending this post. I want to say: Happy Mapping! :)

Location: Jogowal jattan, Kalanaur Tahsil, Gurdaspur, Punjab, India