
I worked on Norse and Orchard in Golden Colorado. The area could use some mapping love.
Info from:
 OpenStreetMap
I worked on Norse and Orchard in Golden Colorado. The area could use some mapping love.
Info from:
I am going to make some improvements to the Walla Walla Washington area over the next week. I’ve just found the Rapid editor uses the Microsoft Building Footprint data to suggest features. That’s excellent. Speeds things up significantly.
I worked on Lloy street today in Portage MI. It could use some mapping love. Streets are there but not much else.
Porage GIS: https://mi-portage.civicplus.com/177/GIS-City-Maps
Today while looking at the hand drawn parcel maps that the county provides I learned the creek that runs through my neighborhood has changed it’s name. On the maps it’s called Sulphur Spring Creek. On all the other maps I’ve seen, road signs, and from what we locals call it, it’s just Sulphur Creek. There’s even a nature center / animal rescue that is named for the creek. They don’t use the spring in their name either.
OK… after getting the comment re sulfurous springs, I did some digging. I haven’t found any historic proof of the claim in this article from last year, but …
“Nestled in the Hayward hills, the Sulphur Creek Nature Center is home to dozens of birds, amphibians, reptiles and mammals, including a coyote and a fox. The site straddles a small section of Sulphur Creek, named after the sulphur water bubbling up from nearby springs. In 1970, H.A.R.D. acquired the property, then a wellness retreat, and transformed it into the animal sanctuary it is today.”
The “spring” part of the creek is shown to be at the current location of the nature center. The other creeks that feed into it have been conflated into all being “Sulphur Creek” I suppose.
https://tricityvoice.com/sulphur-creek-nature-center-completes-renovation/
The Belgian OSM community is importing buildings from governmental data into OSM for some years now. In December I was supposed to present a analysis about this process regarding the import of buildings data from the PICC, the source of data for the Walloon region.
Unfortunately I got sick and I could not present. Anyway, here are some key numbers about this process not only for Wallonia but for Belgium.
In Belgium, there are 3 different sources of government data for buildings, each one for the 3 regions of Belgium: Flanders, Wallonia, Brussels. All these sources are integrated in what we call the “building import tool”: the web application buildings.osm.be. People who want to use this tool are encouraged to learn about the import process and to conflate (merge) with existing buildings. In many places indeed, there are already buildings in OSM and integration of every single imported building with existing ones is the preferred way, rather than “delete and replace”. We also ask to not blindly trust official data and to always look if current data in OSM does not bring interesting added value in terms of accuracy and/or local knowledge. After all, it is one of the key force of OpenStreetMap.
Having imported thousands of buildings myself in the past 3 years using this tool, I found some weird situations in the government data: oddities in house numbering, strange shapes of buildings compared to aerial imagery, etc. Honestly, these are very rare situations, but still it might be interesting to report it to the administration. What is more frequent are update of buildings compared to official data: during the import, by comparing with the aerial imagery or local knowledge, one can find some new buildings, or demolished ones, or some changes in the building outline.
For other opinions, see this thread: https://community.openstreetmap.org/t/feedback-about-the-buildings-import-process-for-the-picc/138241
In regards that the tool https://wiki.openstreetmap.orgdata.link works best with smaller administerey areas I will break it down on the municipality level(Kommun in Swedish) we have 290 in Sweden.
To be served a table which have the following data:
| municipality(kommun) | Amount of linked lakes | Total amount of lakes | Precentage |
|---|---|---|---|
| Total amount of municipality(kommun) | Total amount of linked lakes | Total amount of lakes | Total Precentage |
Kategori:Insjöar i Sverige efter kommun
I will then query each municipality(kommun) using Sophox in the SPARQL language on each municipality(kommun) (by name). I will then get a list of QID of all the wikidata lakes that I then can use to ask Sophox if any element has that wikidata QID. If anyone has that
They are inported some time the last 10 years from the national database of lakes and bodies of water called VISS Bots created the articles on Swedish wikipedia from this database and this is the reason we now can link the data from OSM to the wikipedia articles through the wikidata QID on the water=lake polygons(enclosed ways/areas and multipolygons).
Hi! I’m @likeToTravel, and I suck at writing, so I’m gonna go straight to the point:
?c= in the link. Or, just go to…turn, especially turn:lanes=*& turn:lanes:*=*.To my hikers, OSM Destination Signs.
I´m trying to start a project to learn SPARQL to be able to get on how many of the 63 00 lakes which are in swedish wikipedia/wikidata has their wikidata tag on the OSM element. If the OSM element contains the wikidata tag we can show the proper zoomed polygon in the template sidebar on the articles in all their glory, instead of just a coordinate from wikidata. Mall:Insjöfakta Sverige is the template which makes this possible, please share it for other purposes to use the maplinked feature on other WMF Wikipedias than sv.wikipedia.org!
https://en.wikipedia.org/wiki/Wikipedia:Why_mapframe_maps%3F
Honestly, I have been reading everybody’s diary entries and diving in and looking at all the different areas and detail and I forgot how I even got here! NO idea but I am very intrigued I do not know how much I will have to contribute but I’m determined to figure this all out! I’m fresh meat here amd have never heard of openstreetmap until I landed in the middle of Nigeria very far from home…safe travels and Merry Christmas from Michigan 🇺🇸💋
Love and Light Aphrodite888
I was doing some Unmapped Small Town USA work this evening, and realized that I had tagged a bunch of probable grain silos in other areas as buildings, specifically in Arbela, MO, and Granger, MO, so I’ve gone back in and corrected those to more accurately reflect their purpose. Apologies to Arbela and Granger!
Otherwise, Dover, KY showed up on Unmapped Small Town USA. There’s some great progress already, but still more to do, so I’m taking advantage of some holiday downtime to fill in more buildings.
Otherwise, I hope you have a lovely Christmas Eve, if that is your custom, and a lovely Christmas Day, if that is your custom. If not, I hope you have a very Merry Thursday. :)
It is both weird and cool to see the map of my community change in apps I use regularly. Before I started actively updating things in OSM I didn’t recognize all the places OSM is used.
Last November, I [Re]Introduced Ultra v3 which introduced a bunch of new features. Today, I’m happy to share what’s changed in Ultra over the past year.
Since my last update, I’ve implemented the following features in Ultra:
In January of 2025, Ultra updated to the freshly released MapLibre v5, introducing globe support!
 View Example
Since then, further MapLibre changes have enabled a host of new styling features including:
color-relief styling from raster DEM sourcesline-dasharray supportI’ve added two sprite-related features to facilitate map styling:
As a principle, I’ve always tried to use open-source software over proprietary software for any of my digital needs. I’ve personally found open source to be both more accurate and more sensible to use than proprietary alternatives.
One of the very few aspects of my life that had still not adopted open source was maps. I always used both Waze and Google Maps for everything. But whenever I looked at the maps, it felt like something was missing. I looked around, checked the environment, and realized how much of my surroundings simply wasn’t reflected on the screen.
I wanted to fix it, but… Google Maps doesn’t allow you to just add things. And while Waze does have an editor, it’s extremely locked down for the average user. So, I looked up online alternatives.
I discovered OpenStreetMap two months ago, and I found myself in awe of the sheer amount of detail… Far more than Google Maps or Waze could offer. It just so happened that I was on a trip to Barcelona, and I was using CoMaps to navigate. Using CoMaps proved extremely reliable, especially for public transportation. I never missed a metro, I found all my destinations quickly, and it was very easy to get around.
Still riding the Barcelona high, I opened CoMaps back at home and was fairly shocked to see that my neighborhood didn’t exist at all… Where the heck is it?!
So, I got on my computer, logged into OpenStreetMap for the first time, and started using the iD editor. In just a few hours, the rough outline of my neighborhood was there.
Soon enough, I found myself mapping for hours. Even during lectures, I’d have an OSM tab open for casual mapping. Then it escalated. I started bringing my laptop everywhere I traveled to map things on the go. I began using StreetComplete to add missing metadata. I took pictures and videos. Then I started recording GPS traces. And now I’m even considering setting up a full LiDAR mapping mount for my car…
OSMWrapped is a fun tool that visualizes your personal OpenStreetMap (OSM) mapping statistics — including edits made, countries mapped, and active mapping days.

Today I’m celebrating one full year of mapping every single day! 🎉🥳
Grateful for the OSM community and the joy of contributing, one edit at a time.
Cheers!
93/93
So, as it turns out, Mapmas is best-effort. ;)
I came down with something Thursday night, and I’m just now starting to feel sufficiently decent. I housed 3/8 of a pizza last night, which means my appetite is back. I mostly took it easy, but I did have a little energy to start tracing out a lot of Mechanicsburg, Virginia, United States, which was posted a few days ago on the Unmapped Small Town USA Mastodon account.
Appalachia is beautiful: rolling mountains, verdant woods, small houses and farms dotting the countryside. I’ve had the privilege of traveling through Virginia and West Virginia in the past, and it’s even more gorgeous in person. Lush tree coverage, though, does make it a little challenging to trace buildings when imagery is from spring/summer, so that was tough at times. I’ve noticed the houses in the region are also more likely to have tight corners, or a roof line that turns and then juts out a half meter or so, which can look like slight distortion on imagery, but is actually part of the geometry. I took some liberties, but I did my best!
I also struggled with finding independent sources for things like street names. It looks like Virginia state highways use the same numbers across the state, but are disjoint, and correspond to different local roads in different areas. So State Route 653 in Bland County, for example, is Osborne Drive in Mechanicsburg. This particular fact shows up in a VDOT report from 2017, I think (I’d need to source it again), which I believe is okay to use? I’m not entirely sure, though, so I left it for now. Copyright law is obnoxious.
Anyway, it’s nice to be able to sit and map from home when you can’t go outside. It was fun to spend some time in Mechanicsburg and get to know the area a bit.
Onward and mapward!
One OSM-related activity I spend lots of time on is micromapping recreational areas, such as parks. Manually detailing out areas is satisfying, but I’ve also been on the lookout for ways to put my programming skills to use.
A common pattern I noticed in these areas is representing a block of pitches or courts (such as tennis courts) as a single, abnormally large “tennis court”.
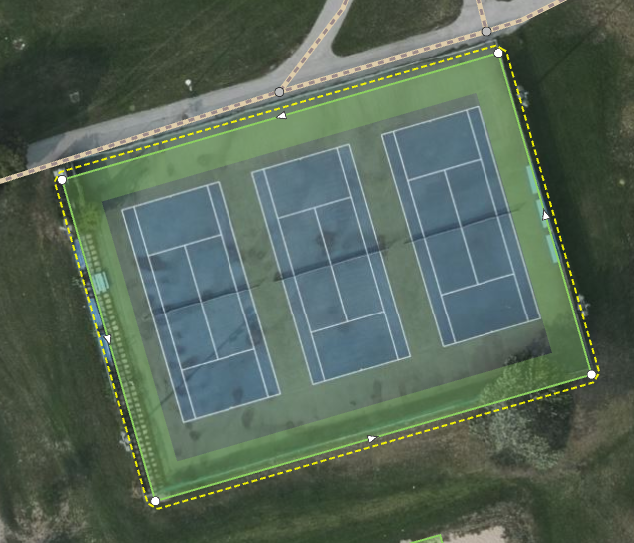
It’s a start, but obviously could use some refining. Each individual court could be represented by a separate area. While this probably needs no justifications, I’ll provide a few since I’d like to convince myself I’m working on improvements that might mean something to someone, rather than just creating data because it gives me dopamine:
(Writing a short stub in case i forget it again)
Estonian mappers may have already noticed how this year Land Board’s imagery is still missing. Previously new orthophotos were captured in March-April, preliminary release was in May-June and TMS layers were available in OSM editors by around September, then this year there are no images.
Turns out on 31st of March 2025 someone filed a complaint to Chancellor of Justice, that their garden hose can be identified on the imagery. On 27th of November chancellor’s response was published and public broadcaster published few small news:
At least 90% of OSM’s data originates from Land Board’s imagery, either through imports or via usual imagery tracing. Esri and Bing are also using using Land Board’s data for Estonia.
Today, i wear a T-shirt printed with Medan’s road network, based on OpenStreetMap data.

Every time i glanced down at those tangled lines, a quiet curiosity crept in. I kept wondering who mapped this exact line segment I’m looking at right now, which contributor traced it, corrected it, or patiently aligned it to reality. It’s a strange and comforting thought, carrying a small piece of someone else’s mapping work on fabric, a reminder that this map is made of countless individual moments of care.
Irpavi 2 South Route
The city of La Paz, Bolivia, has the Puma Katari public transportation service, which covers the 9 macro districts and is currently deployed through 10 routes. Since its launch, this service has been a great promise, offering benefits such as preferential treatment for people with disabilities, children and the elderly, in addition to allowing the transport of bicycles in the front compartments of the buses, thus encouraging the use of this means of transportation. ecological. We are often traveling to different places in the city to carry out our field work. We know that some visitors or even people who know about this transportation service face difficulties because they do not know which route to take or where the stops are, especially when trying to reach peripheral areas.
Over the past year, I made a lot of contributions to Regina’s OSM. Since snow has made surveying difficult, I felt a retrospective on those contributions were a good idea. Many edits came through the StreetComplete app, though more intensive projects have called for desktop editing. Creating a separate network for sidewalks and starting to make indoor maps for a couple buildings are the items I’m most excited about. The changes made to the Regina Wiki page on OSM were pretty large but hopefully will give a good overview of where active mapping projects are at. Creating a wiki page for Regina Transit will hopefully help to make updates to it easier to coordinate.
You can read more on my blog post here: https://www.malleyeno.com/Blog/Winter-Retrospective-2025—OpenStreetMap-for-Regina


