 OpenStreetMap

.
Diary Entries in English
Recent diary entries
Posted by Dibikshya Shrestha on 12 June 2025 in English.

When I first received the email notifying me of my selection for the YouthMappers Leadership Fellowship 2024 in Thailand, it was a surreal moment. I was doing my assignments all frustrated but suddenly when the notification popped up, and I couldn’t contain my emotions. I jumped with joy, overwhelmed by the thought of being chosen for such an incredible opportunity. That email was the start of an unforgettable journey—one that would take me to new places, connect me with passionate individuals, and leave me with memories I’ll cherish forever. The dream of the dreamer started since then. The preparation for the fellowship began months in advance. YouthMappers, a global community of students, researchers, educators, and scholars that use public geospatial technologies to highlight and directly address development and environmental challenges worldwide ensured we were well-prepared with pre-departure sessions and constant communication through emails and WhatsApp. They guided us every step of the way, taking care of us with unmatched warmth and care. From learning how to say “Sawadike” (hello) and “Khapunka” (thank you) in Thai, to planning and packing for the trip, every moment was filled with excitement. The day of departure was momentous—my first international flight, passport in hand, and butterflies in my stomach. Along with my Nepali peers, we clicked countless photos at the airport, thrilled to embark on this journey. As our flight landed in Bangkok, the sparkling city lights welcomed us to a country that truly never sleeps. Angela, our warm and wonderful guide, greeted us at the airport, setting the tone for an amazing experience.
First Impressions and New Connections
Posted by tukangsampat on 11 June 2025 in English.
Last updated on 23 November 2025.

If anyone who want to edit Indonesian maps, I recommend using BHUMI ATR/BPN aerial imagery data as source. The link is cited as below:
https://bhumi.atrbpn.go.id/petadasar/wms/{x}/{y}/{z}/20240228.png
The primary reason I use BHUMI is their data quality is crisper and detail than Bing/Esri data (but as crisp as OpenAerialMap data), more extensive (OAM has limited coverage; in Indonesian context, their coverage is tinier than a grain of rice) and as a work of Ministry of Agrarian and Spatial Planning (Kementerian Agraria & Tata Ruang/Badan Pertanahan Negara), based from open data and their BHUMI website does not mention the copyright, it is in public domain (art. 43 point B of 2014 Copyright law/UU No. 28 Tahun 2024).
(You may object the last one, as I judge it solely on their website’s statement and my limited understanding to Copyright Law. In their website, the term of use is only limited to general responsibility using BHUMI ATR/BPN data. If you consider their data as copyrighted, that means 2 months’ worth of cleanup. Not an easy task, I hope don’t let it happen!)
However, some of their data might be not up to date or broken, so please cross-check with less than detail Bing/Esri data and zooming in and out, because you could get detail out of it.
I have big wish about this: ATR/BPN keep making high-quality imagery, and Indonesian OAM contributors to do the same, not just waking up when they do a mapathon!

Load testing vector tiles
As part of bringing the new vector tile servers into production, I had to benchmark their performance. Since there’s a cache in front of the servers, it’s challenging to benchmark them accurately. Although we’ve never had a heavy load on the vector tile servers, we’ve been running raster tile servers for years.
All tile requests on the standard layer are logged, and from those logs, I can generate a list of tiles to benchmark the vector tile servers. The logs are stored as Parquet files, which I query using Amazon Athena, a hosted Presto database.
Vector tiles and raster tiles typically have different scales at the same zoom level. To convert raster tile requests to equivalent vector tile requests, I divide the x and y coordinates by 2 and decrease the zoom level by 1. I also skip zoom 0 raster tile requests to simplify the process, as these don’t affect performance since zoom 0 is always cached.
The OSMF shortbread tiles have a maximum zoom of 14. Lower scales (higher zoom levels) are achieved by overzooming on the client side. Requests from zoom 1 to 15 should have their zoom level lowered by 1. Requests from zoom 16 to 19 need their zoom level decreased by the difference between their level and 14. I divide the x and y coordinates by 2 the appropriate number of times to match the new zoom level.
Filtering to have only cache misses gets me a request list on the backend servers.
SELECT
    CASE WHEN z > 15 THEN 14 ELSE z - 1 END AS v_z,
    bitwise_right_shift(x, CASE WHEN z > 15 THEN z-14 ELSE 1 END) AS v_x,
    bitwise_right_shift(x, CASE WHEN z > 15 THEN z-14 ELSE 1 END) AS v_y
    z, x, y
FROM fastly_success_logs_v1
WHERE year=2025 AND month=5 AND day = 1 AND hour = 1
    AND z >= 1
    AND cachehit = 'MISS';
Unfortunately, this is the wrong list.

I’ve undertaken the task of mapping Inveralmond Industrial Estate, which lies close to my location but is currently not mapped in any great detail. While most buildings were drawn onto the map fifteen years ago, only about 25 businesses have been added since then—and I contributed half a dozen of those entries just a few months ago. At least two businesses that were added years ago have since closed permanently. Last Sunday, I conducted a preliminary survey of the area, capturing dashcam footage that helped me compile a list of fifty additional unmapped businesses. This number will likely grow substantially, as I left out the minor roads in the estate during this initial pass. My estimate is that the final count could easily reach one hundred businesses. This pattern reflects a broader issue: industrial areas consistently suffer from poor mapping coverage. That’s my take on it anyway from the areas I’ve looked at. I’m currently testing the iOS app Every Door, and plan to conduct comprehensive field mapping in the coming weeks. My goal is to document everything from the largest manufacturing facilities down to the most modest infrastructure, including grit bins. osm.org/#map=16/56.41782/-3.47651
Posted by Ayush Dhar Dubey on 8 June 2025 in English.
Last updated on 29 August 2025.

The Community Bonding Period officially wrapped up on June 1, and the coding phase is already off to a solid start.
During CBP, we successfully migrated the legacy 3DMR repo from GitLab to the new official GitHub repo. This cleanup made collaboration and discussions way easier. I also dove into pygltflib to handle glTF files, experimented with the obj2gltf converter.
I spent a good chunk of time mapping with the iD and JOSM editors, focusing on features from my home village. It’s oddly satisfying to see buildings you’ve walked past for years show up as polygons and tags. I plan to keep adding more local features whenever time allows. I experimented rendering both my mapped data and some iconic Indian landmarks using OSM2World, let’s just say it made my village look unexpectedly fancy.
With coding underway, my first priority was building out the test suite. The project didn’t have one before, which would’ve made every upgrade feel like defusing a bomb in the dark. I’ve opened a PR for it, currently under review. While working on this, I found a few minor bugs lurking quietly in the codebase for years, filed them, fixed them, and thankfully had those PRs merged.
The Django 5.2 upgrade is nearly done and is clinging on my forked repo as i am writting this… Most dependency updates and refactoring are complete. Now I’m exploring edge cases, making sure nothing’s hiding in the shadows ready to throw a 500 error when nobody’s looking. Once the test suite merges, we’ll be in a much safer spot to modernize the stack.
On the personal side: I’m a long-distance runner and have been using summer break to improve my endurance. I run 5 to 7 kilometers daily, a good counterbalance to all the screen time, long debugging sessions, and occasional existential dread that come with working through old code 🙃. I also have a few books lined up, both fiction and non-fiction, hoping to get through them—unless I get distracted again.

Recently, I needed to open my OpenStreetMap profile—just to right-click and save my own profile picture for use on another platform.
Thanks to the newly redesigned OSM profile layout, I was greeted by a few new statistics—one of which showed how many comments my last diary post had received. While I was busy grabbing my avatar, I couldn’t help but notice that my recent diary post had garnered quite a bit of discussion.
To my surprise, at least two commenters pointed out the same thing : they suggested it would be more intuitive if the value reflected actual months, rather than “something that roughly represents the progress of the year in base-10.”
That got me thinking—how hard would it be to convert that base-10 year-progress value into something closer to a conventional month (base-12)?
Step 1: Extract the Year
To compute the year from an OSM timestamp (Unix time), we start by offsetting it from a known reference point—specifically, the Unix timestamp for the start of the year 2000.
(osm_timestamp - 946692127) / 31556952
- 946692127 is the Unix timestamp for Sat Jan 01 2000 02:02:07 GMT+0000. This value was arbitrarily chosen by me (high accuracy isn’t necessary; I just needed a reference point roughly around the year 2000).
- 31556952 is the average number of seconds in a year (365.2425 days).
This gives us a floating-point number: the integer part is the year offset from 2000.
To extract the integer part (representing the year), we can substring the first 2 character:
substring(divided_by(osm_timestamp - 946692127, 31556952), 0, 2)
Oh wait!
While writing this post, I stumbled upon a small but interesting bug from the initial release.
Originally, the code extracted the first three characters of the computed year value. This worked fine for double-digit years like 2010 and beyond—10.5 would yield “10.”, which was sufficient for identifying the year and using the decimal as a makeshift separator between year and month.

.

As OpenStreetMap becomes a central part of global mapping infrastructure, it’s worth asking:
Are corporations offering as much or more as they are getting from their OSM involvement?
Some corporations benefit enormously from OSM using it to build commercial services, run logistics, and analyze market data. But these same companies often have access to large, rich datasets, especially from telemetry and user behavior, that are far beyond what the average contributor can collect.
If shared, such data could dramatically improve OSM’s accuracy, completeness, and utility. But how much of this data is actually being shared?
There’s a tension here between open knowledge and proprietary advantage. While some companies do contribute back through edits, funding, or tools, the scale of these contributions doesn’t always match the value extracted.
This leads to deeper questions: - Is the current model of corporate engagement with OSM sustainable? - Are the benefits of the open model being eroded when sharing isn’t reciprocal? - Could new norms or frameworks encourage deeper, more equitable collaboration?
The OSM community thrives on openness, transparency, and volunteerism. As more private actors join, the long-term health of the ecosystem may depend on whether those values are upheld not just by individuals, but by corporations as well.
Posted by b-unicycling on 6 June 2025 in English.

My parents had rented a barge to explore the Barrow Navigation in Ireland for a week. I joined them on three days to capture water-level imagery with my GoPro (and to catch up with them as well). There are unfortunately 1.7km missing where the battery of the camera ran out, and there was no place to moore to exchange or charge it.
All the images are uploaded to Mapillary (Sequence key for 1st sequence: l2Yx6tGPdI9qRUAwZLvTFe) and Panoramax (Sequence key for 1st sequence: 7fe2a04f-e18c-4cf3-8bb5-48af1d1cf7ad); there were 2,446 in total, if I remember correctly. This being Ireland, of course it rained for some bits of it, so the images between Carlow and Athy are a bit blurry.


hi
At work1, I started creating a real pedestrian routing that uses sidewalks rather than the middle of the road (unlike most pedestrian routing software nowadays). This is necessary for calculating safe routes to and from schools. In this case, it really matters which side of the road the children use and which crossing they take.
The OSM community mainly uses two methods of mapping sidewalks (and the choice between these two methods directly influences the mapping of crossings): One option is to attach them as tags to the road (for example sidewalk=both), and the other is to use separate geometry. In this post, I would like to show an example where mapping the geometry separately makes a huge difference.
A Dangerous Crossing

The image shows one of Germany’s most dangerous places for pedestrians, according to accident statistics 2. This crossing is located near Rothe Erde in Aachen.
The following figure, taken from a screenshot of JOSM, shows the OSM data for this crossing.3

10 years + a few days ago, we held the White House Mapathon.
Over a hundred mappers gathered and livestreamed the happenings, shared stories of cool mapping projects, dialed in Peace Corps volunteers from the across the globe, and naturally mapped. There were cake pops decorated like globes. Along the walls, stunning reproductions of historic American maps provided by the Archives (I snagged a couple prints, they hang in my office to this day). Everyone dressed formal for the setting, except Alex Barth in usual attire, commenting “Wow OpenStreetMap is fancy today”.
Can you imagine that occurring today? Unimaginable. Of course not.
These kinds of convenings are by their nature fleeting. A recognition and shared touchstone for future work. Yes a bit hype-y, but grounded in real work and real opportunity. This was the era of upswing in open government, open data, the early days of 18F and USDS. The community that gathered there continued championing open mapping in the years after. Some of the most enduring are YouthMappers https://www.youthmappers.org/ and OSM US government initiatives https://openstreetmap.us/our-work/trails/.
We’re now in the age of BS. Truth or not does not matter. That comes from government and AI vibes.
got exams will return
Posted by Baloo Uriza on 31 May 2025 in English.

OBDL but governments like Hungary (homophobia), Isreal (genocide), groups like the Republican Party (every stripe of bigotry imaginable) and companies like Tesla (same) are blanket excluded from using, copying, redistributing or accessing OSM data in any way, shape or form?
Posted by SaidAbouKharroub on 31 May 2025 in English.
My name is Saïd Abou Kharroub, and I’m truly honored to be nominated as a candidate for a 2025 HOT voting member. I’m excited to share a bit about my journey with HOT, my current work in Lebanon, and my aspirations as a voting member.
To me, HOT shows the incredible power of people working together with open data in humanitarian crises. It’s amazing how a global community can use mapping to make a real, life-saving difference. What I really appreciate is HOT’s dedication to empowering local communities and building a space where knowledge and skills are freely shared.
My involvement with HOT became very personal and hands-on through the “Lebanon: Conflict - October 2024” project. I got involved when I arrived in Lebanon in January 2025, taking on the role of Lebanon Local Consultant for HOT’s H2H funded project, “Collaborative Approaches to Mapping Damage in Lebanon.” I’ve also been a strategic advisor for CivAPI.com, a data API provider that includes OpenStreetMap layers like buildings, roads, and infrastructure. This advisory role has given me an even deeper understanding of how crucial data provision is in humanitarian and development work.
In my role in Lebanon, I’ve focused on coordinating local data efforts, engaging with important partners, and advising on data protection, especially given the local context. This work includes:
Organizing and hosting local mapathons to grow the OpenStreetMap community and fill important data gaps for humanitarian response. We’ve already held our first mapathons with the Lebanon Reforestation Initiative, Beirut Arab University and are planning the second with the Beirut Urban Lab.
Working closely with HOT staff and humanitarian partners to address specific infrastructure gaps, often responding to requests from groups like UNOSAT.
Posted by SomeoneElse on 31 May 2025 in English.
Last updated on 12 June 2025.
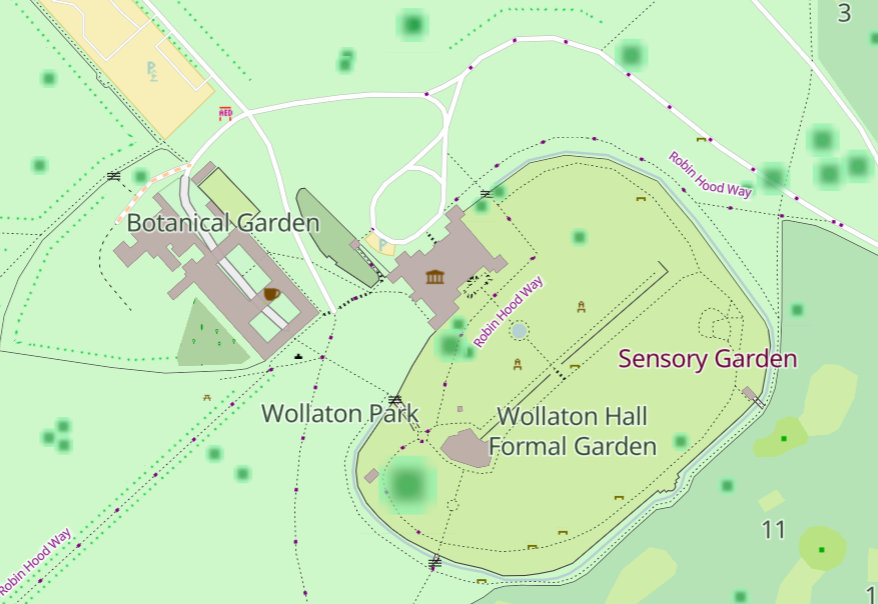
The diameter_crown tag is fairly well used for trees. It’d be nice when showing trees to show larger ones as larger than smaller ones. One challenge is that the values can be a bit hit and miss. There are a couple of sorts of issues there:
One is “obviously silly values from an import gone wrong” like the 289 diameter_crown=width: 2.0; color: green; that have found their way into the database, perhaps by a failed JSON conversion.
Another is “human but not machine readable values” like “4 - 7 m”
Another again is implausible values for certain tree types. For example, this is apparently a London Plane that is 5 times wider than it is high. That’s technically possible with a bit of pruning, but unlikely. Much more likely is that the data was not sanity checked before import, and the “diameter” figure here is actually a “circumference”.
In order to work around these issues, when processing the data prior to display I:

Hi community I’m sharing my application to become a Voting Member of HOT through this diary entry.
What does HOT mean to me?
For me, HOT has been a true school since I started mapping in OpenStreetMap. At the end of 2022, as a founding member of the YouthMappers SAGEMA chapter, we were excited to begin using this tool in our research and community work. My first contact was with Juan Melo, Data Quality Senior Associate at the HOT Open Mapping Hub for Latin America and the Caribbean, who became a mentor to our chapter and taught us the tools we needed to organize our first mapathon at the campus of the Universidad Nacional de Colombia. After that experience, I decided to get more involved in volunteer mapping. That’s how I discovered the Tasking Manager and participated in my first humanitarian project: mapping after the earthquake in Morocco. That experience showed me the real impact of OSM, and how with just a little time, we can help save lives. Since then, I have been part of various HOT projects, and each of them has been a constant learning space. HOT has not only been a platform for action, but also a space for training, connection, and personal and collective growth.
Posted by ellieayla_ on 29 May 2025 in English.
In the Halton region in Ontario Canada (and probably elsewhere), many two-way streets split with a boulevard are modelled as two one-way street segments (eg Way 286996210).
It has been observed (2025-May) that many (2025 May, n=244) of these are tagged cycleway=lane, which incorrectly renders in cycling maps as having a bike lane on both sides of the street.
Eg https://www.cyclosm.org/#map=18/43.33590/-79.81317/cyclosm
Many (all?) of these should be tagged cycleway:right=lane instead