OpenStreetMap

Update: Check out my comment below about the state of the art being greatly improved!
The idea
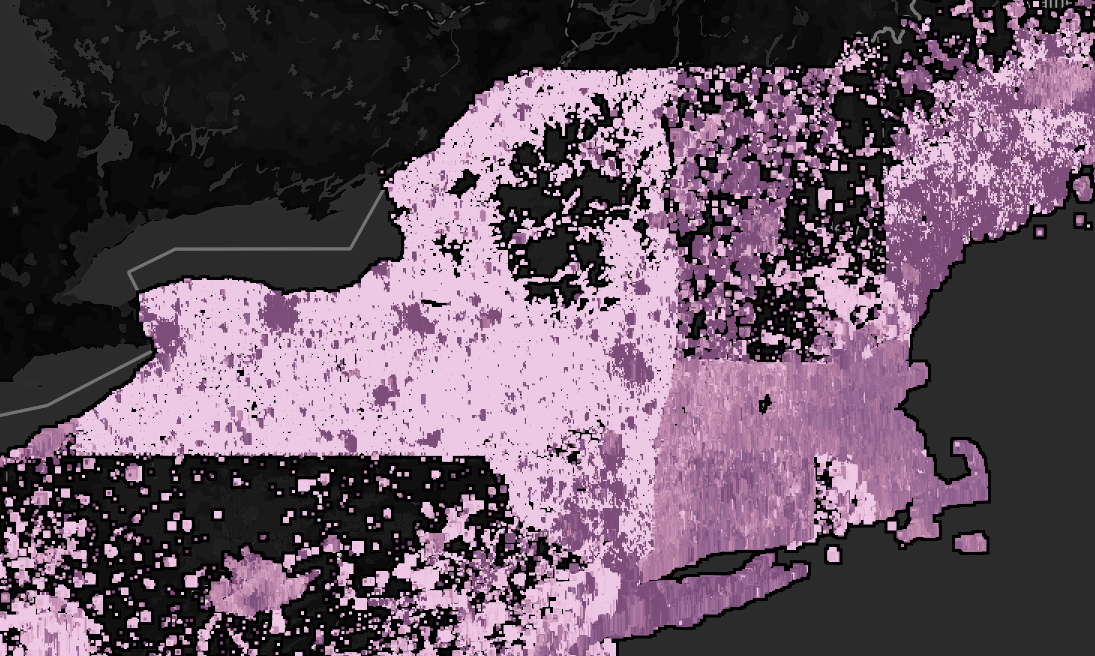
After finishing my first address import I was looking for a good view of “where else needs addresses”. One trick that always pays dividends for me is to look at distributions of ratios of various quantities. In particular, I presumed there should be a pretty smooth distribution to the ratio of number of addresses vs number of buildings in any given area.
Building it
- Get the data from Geofabrik state data dumps (US regions are too big for the tools)
- Use osmconvert to flatten out ways and relations. Something like:
osmconvert alabama-latest.osm.pbf -o=alabama-nodes.csv --max-objects=50000000 --all-to-nodes --csv="@lat @lon addr:housenumber building"- A bit of C# to do the binning (I’m sure QGIS and other tools are great for this but you use what you know)
- Tableau Public for the viz generation