Diary Entries in English

Recent diary entries

Posted by WARUMICHRADFAHRE on 1 November 2022 in English. Last updated on 2 November 2022.

What did I do on OSM in October? First of all, I reactivated my user account and orientated myself a bit. Then I started uploading special cycling tours of mine as gpx. I recorded the tours before with the OSMAND+ app and then uploaded them, as well as some POIs.

That’s just a start.

Besides the OSMAND+ app, I use UMAP on the net, which is also based on OSM. You can find my tracks here:

osm.org/user/warumichRadfahre/traces

I have been cycling very actively since 2010 and record all my rides and keep detailed statistics. You can find my last monthly report here:

https://sway.office.com/qEbb1HRwoK3SfWDy

Posted by Cristoffs on 1 November 2022 in English.

At the request of OpenStreetMap Ireland, I am sharing the lessons learnt from collecting AED data in Poland. I hope to also help other local OpenStreetMap communities with this type of project.

Instead of an introduction.

There is no official record system for these devices in Poland. Both of these databases are closed and the locations of AEDs they contain are highly imprecise, with descriptions missing in many places and the accuracy leaving much to be desired. Our initial analysis has shown that there is little or no usefulness of this data for rescuers.

For this reason, we have decided to start collecting this data and, in order to facilitate this process, to prepare a portal that will support us in this task and, at the same time, display the devices already entered in order to motivate non-OSMP editors to search for and enter their locations into OpenStreetMap. I will try my best to describe the process we have arrived at by trial and error during this project.

Make a plan!

A necessary step was to adopt a minimum usability label for the location of the devices by talking to colleagues involved professionally or voluntarily in the emergency services, and to turn their comments and experiences into a uniform way of labelling AEDs. The fruits of this work can be found on the Polish wiki page: osm.wiki/Pl:Tag:emergency%3Ddefibrillator.

Thanks to the team who created the dedicated AED portal. And is currently working on its international version openaedmap.org, we have had a much easier process of gathering information and greater reliability. Thanks are especially due Tomek, Ancymon, Filip and many others.

We took the tags access and defibrillator:location as key. The following table describes exactly how we standardised the tags for access:

See full entry

On November 15, 2022, the Silver Line Extension in Washington D.C. will open. I edited the new Silver Line stations (Reston Town Center, Herndon, Innovation Center, Washington Dulles International Airport, Loudoun Gateway, and Ashburn) to reflect the new opening date and add more information about them. Still, I was wondering when I should actually route the Silver Line through the new stations, should I do it now since we know the opening date or should I wait until November 15? In addition, I know that Metrobus, Loudoun County Transit, and Fairfax Connector plan on changing, adding, or removing routes to coincide with the new openings, when should I start changing this on OSM?

Location: Loudoun Station, Moorefield, Loudoun County, Virginia, 20174, United States
Posted by TUMAINI APOLINARY on 1 November 2022 in English.

I am currently graduate with BSc in Environmental science and management from Sokoine University of agriculture. Being a geospatial data enthusiast, I have 2 years of open data experience, working as a remote mapper from SMCoSE Youth mapper and Open Map Development of Tanzania (OMDTZ) in the projects mapping the unmapped for flood resilience, by mapping the extent of this project it provides the better understanding of the problems to the community.
I am also currently among the Crowd2Map intern for the year 2022, these internship programs aim in promoting open data quality, delivering quality data and putting rural Tanzania on the map. I am motivated to participate in this excellent opportunity to learn more about open data and also learn how to provide quality data. Through this program, I hope to improve my knowledge of validation.

Location: Mazimbu Darajani, Morogoro Municipal, Morogoro Region, Coastal Zone, 67000, Tanzania

Mountain names. A new front in the never-ending cacophony of US political discourse.

Two recent mountain peaks had their names changed by the US Board on Geographical names and there is disagreement in the change sets on whether the name given should be the new indigenous name given by the US Board or the English translation of the US Board. To be clear though, I have not seen the official name from a primary source.

The two peaks were promptly edited to their new names in the local Dena’ina (North and South Yuyanq’ Ch’ex) but within 24 hours changed to what I assume is the English translation of the new Dena’ina name (North and South Heaven’s Breath).

To me it seems like a cut and dry answer based on osm standards what should fall in the “name=” attribute. The editor that changed it to the English translation may feel otherwise though so and to avoid a change set dispute I emailed the Data Working Group to get their decision. I haven’t heard from them in over 10 days however and I haven’t received a message to my follow up email on whether my email got to them. If anyone is on the DWG is interested in bringing me on to handle these issues, I would volunteer. For now though, I’ll hold off on changing the name back and hold faith in the process.

news article:

https://www.adn.com/alaska-news/anchorage/2022/10/14/anchorages-suicide-peaks-receive-new-denaina-name-of-yuyanq-chex/

relevant changesets:

osm.org/changeset/127584704

osm.org/changeset/127643552

osm.org/changeset/127682614

Posted by SHABANI MAGAWILA on 31 October 2022 in English. Last updated on 3 November 2022.

Mapping

In this diary, I’m trying to show some tips and tricks which can be used by beginner, intermediate, and advanced mappers to improve their mapping capacity and speed up mapping. Hopefully, you will learn a lot and enjoying with these simple tricks. Have fun, and you can even comment and ask in case you need further assistance and training. Welcome, all!

 Java OpenStreetMap Editor (JOSM) 

[Issue1:] How to Map Batch Orthogonal Building
In this scenario we're going to use Mapathoner Plugin in JOSM to draw a batch of Orthogonal Building. So, first, make sure you install Mapathoner Plugin in your JOSM.

[Issue2:] How to Map Batch L-shaped Building

[Issue3:] Draw a Courtyard Building

Validation

At first, many new mappers make a lot of mistakes during mapping. And, this can be caused by some reasons, such as little experience in mapping. Therefore, this part will guide them on what to do and do not, as well as demonstrate some previous mistakes done by mappers.

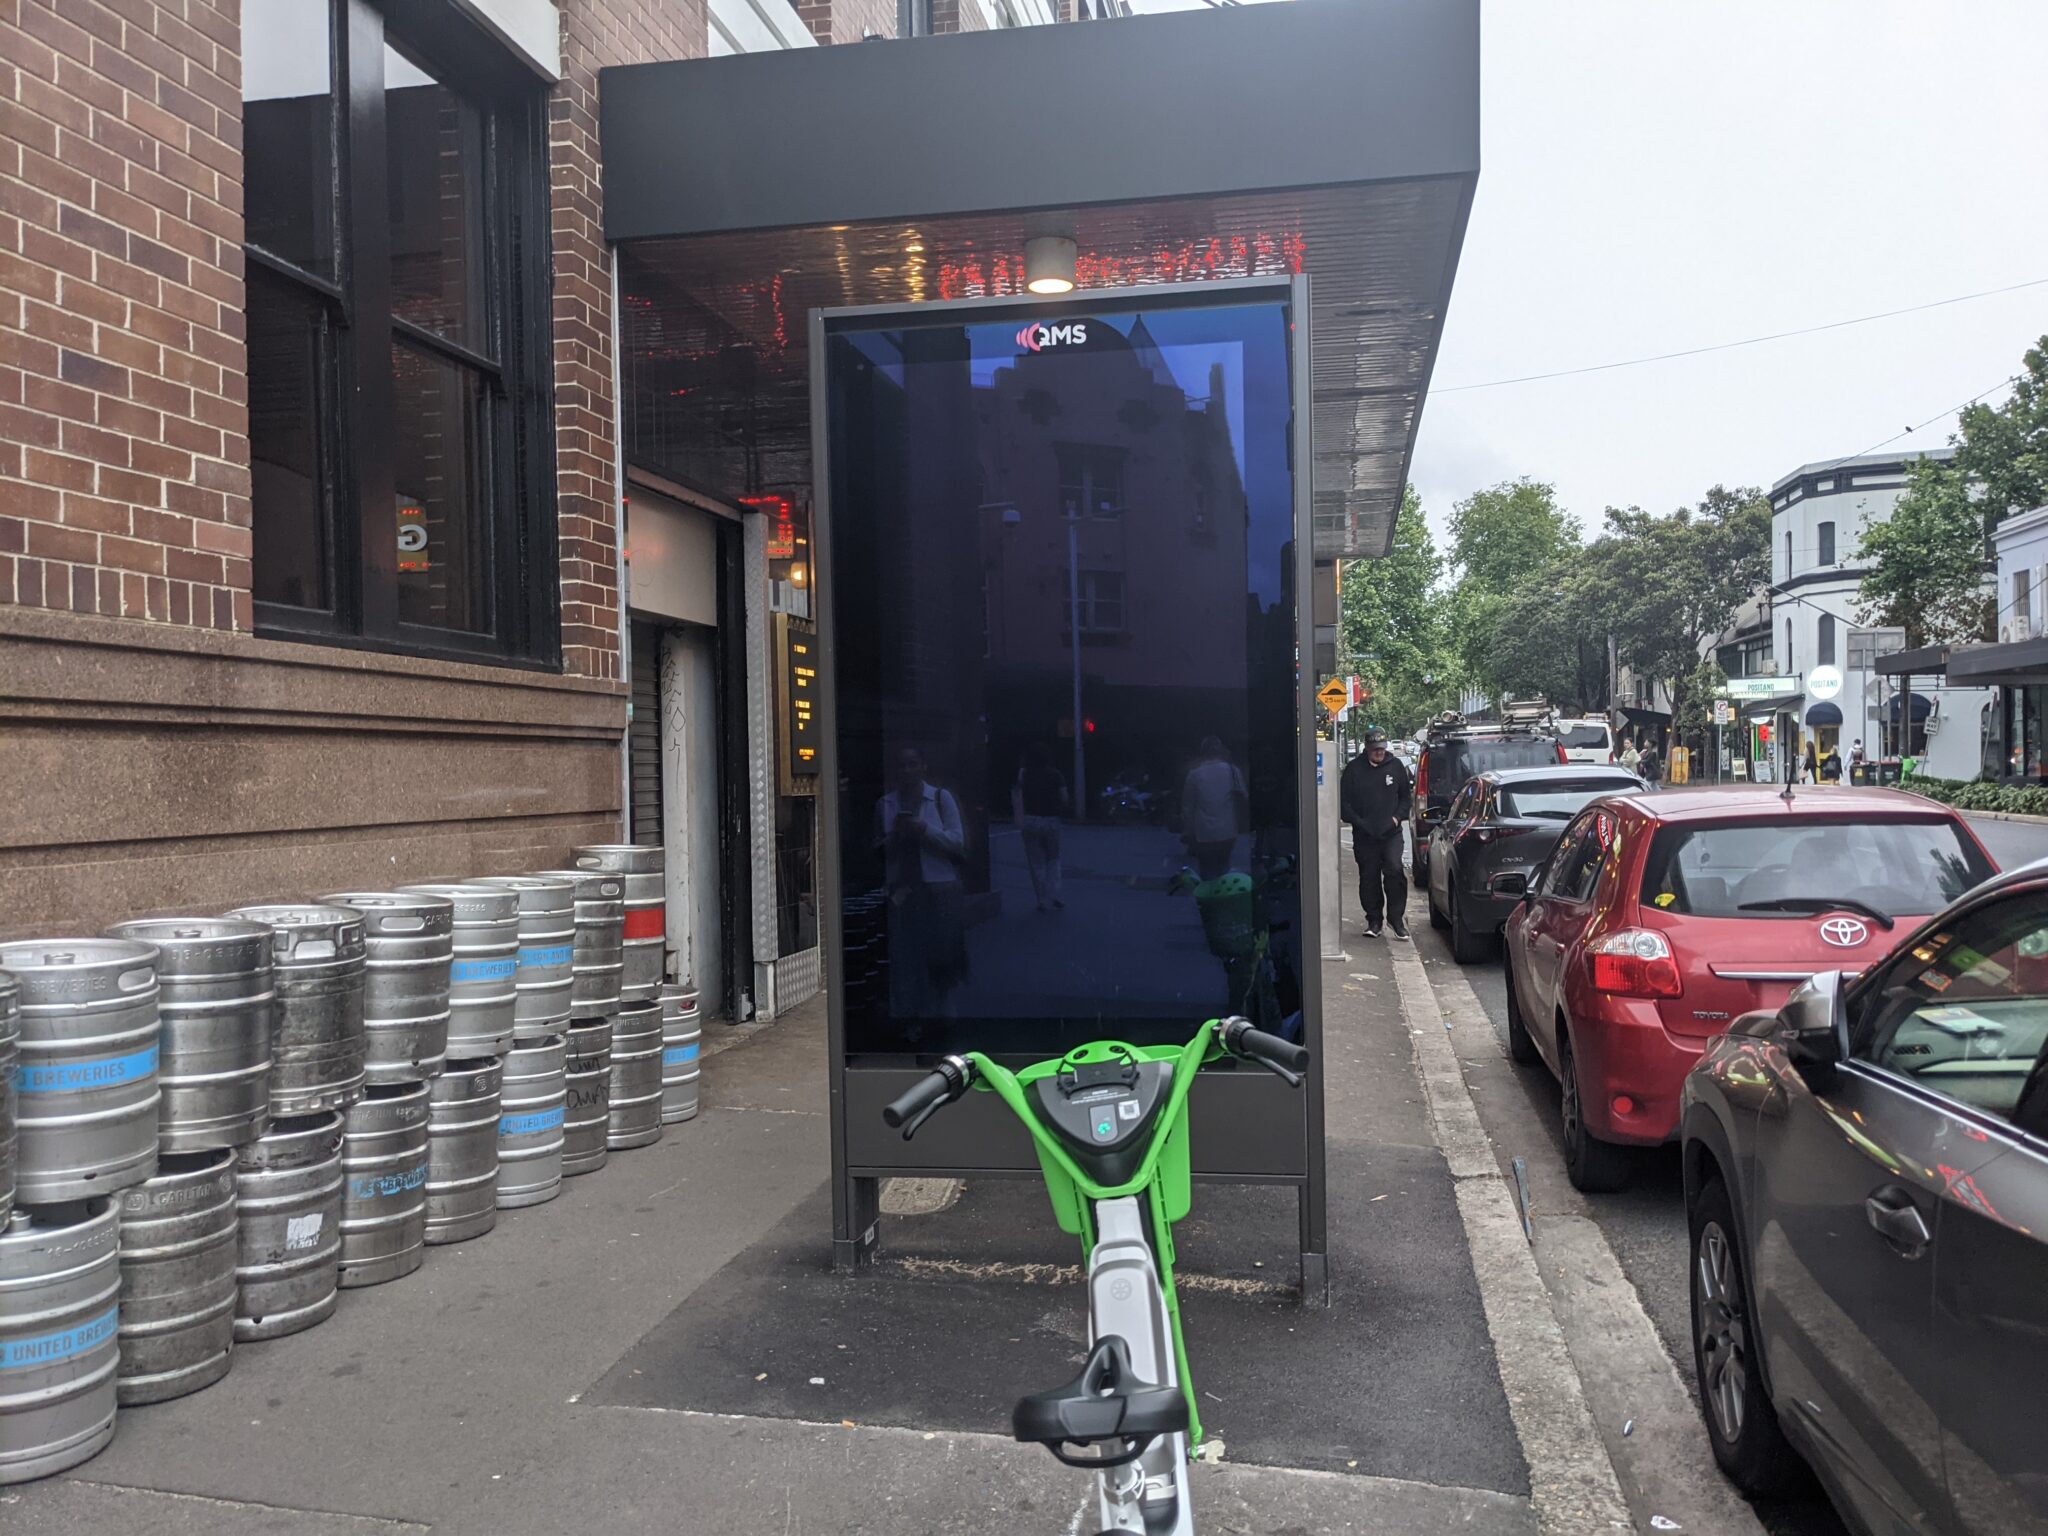
I wrote a blog post about the new advertising panels being installed in the Sydney CBD, and created a map which imports the OSM data using Overpass Turbo.

jakecoppinger.com/2022/10/mapping-sydney-billboards-a-map-of-every-qms-advertising-screen-in-sydney-with-photographs/

Through August and October I visited every QMS advertising panel. I surveyed their location and ref code to add to OpenStreetMap. I uploaded photos of many displays to Mapillary, which you can view by clicking on pins in the map.

Let me know what you think! Any feedback on improving the tagging is also appreciated.

image of ad panel

Location: Sydney, Sydney CBD, Sydney, New South Wales, 2000, Australia

(As I mentioned, I finally caught corona. Combined with a lack of energy, this is a bit shorter)

Previously…

2022 Jan. Feb. Mar. Apr. May June July Aug.        
2021 Jan. Feb. Mar. Apr. May June July Aug. Sept. Oct. Nov. Dec.
2020 Jan. Feb. Mar. Apr. May June July Aug. Sept. Oct. Nov. Dec.

See full entry

It is my pleasure to attend that event (unique mappers network Nigeria collaboration with OSM Rwanda to map Rwanda Monthly Mapathon). I have earned more skills, which will help me to improve my mapping skills so that i can edit too many features like roads, buildings and many others, which will help me to contribute to global spatial data.

Location: -1.969, 30.100
Posted by b-unicycling on 29 October 2022 in English.

As some will know by now, crannogs are my “thing” at the moment. I was hoping to produce a couple of videos about them on my channel, but it takes a bit longer to get the tag approved than expected. And I can’t tell people how to map crannogs when there is no standard.

But I digress…

While mapping buildings in Co. Cavan in Ireland, I had discovered 12 suspiciously circular features in the lakes within the last 3 weeks, and I had reported them to the National Monuments Service this week. They got back to me yesterday and confirmed 3 as actual crannogs (the rest were apparently just naturally occurring circular vegetation).

If you want to check them out, Bing or Esri Clarity imagery are best.

There are a couple more to report, but I’d rather do it in bulk than send an email every 3 days or so.

I made a quick video about it: https://youtu.be/7BJukQ8hKXw

Posted by rhythmicbalancer on 28 October 2022 in English. Last updated on 29 September 2024.

So, two of my interests are tagging waterways and highways. And of course, where they intersect, there is often a bridge. Here is how my bridge tagging method has progressed over time:

  • Bare minimum - split the highway (using e.g. aerial imagery), set bridge=yes and layer=1. This is conventional, if not particularly informative.

Then I found the National Bridge Inventory, which contains not all, but certainly many of the significant bridges in the USA. This data is quite interesting, it includes detailed info on the bridge structure and its integrity.

One can use this to verify the length of the bridge as drawn on the map, in many cases what’s shown in aerial imagery matches to within 1-2m of the specified length. You can also find data on when the bridge was constructed or rebuilt.

  • Added context - add start_date tag.

Today, I was thinking, it’s not much more difficult to add an area object for the bridge structure itself using the man_made=bridge tag. In fact, one could then move such tags as start_date and bridge:structure into the separate object.

There is also an existing bridge:ref tag which is loosely defined. Here’s my idea. What if we used the NBI structure/bridge number, where available (in the USA)? You might wonder why that would be useful. Well there is a site https://bridgereports.com, which parses the NBI database with some additional refinements, and displays a nicely formatted summary. A plugin might use the structure/bridge number to display such data.

Something like the following. For the highway:

bridge=yes
highway=secondary
layer=1
ref=KY 218

And for the bridge structure [edit: updated per discussion in comments]:

ref:US:nbi:state_code=21
ref:US:nbi:structure_number=044B00032N
structure=beam
layer=1
man_made=bridge
start_date=1978

Here’s how the metadata could be displayed (using bridge ID “044B00032N”): https://bridgereports.com/1211803