Diary Entries in English

Recent diary entries

Mountain names. A new front in the never-ending cacophony of US political discourse.

Two recent mountain peaks had their names changed by the US Board on Geographical names and there is disagreement in the change sets on whether the name given should be the new indigenous name given by the US Board or the English translation of the US Board. To be clear though, I have not seen the official name from a primary source.

The two peaks were promptly edited to their new names in the local Dena’ina (North and South Yuyanq’ Ch’ex) but within 24 hours changed to what I assume is the English translation of the new Dena’ina name (North and South Heaven’s Breath).

To me it seems like a cut and dry answer based on osm standards what should fall in the “name=” attribute. The editor that changed it to the English translation may feel otherwise though so and to avoid a change set dispute I emailed the Data Working Group to get their decision. I haven’t heard from them in over 10 days however and I haven’t received a message to my follow up email on whether my email got to them. If anyone is on the DWG is interested in bringing me on to handle these issues, I would volunteer. For now though, I’ll hold off on changing the name back and hold faith in the process.

news article:

https://www.adn.com/alaska-news/anchorage/2022/10/14/anchorages-suicide-peaks-receive-new-denaina-name-of-yuyanq-chex/

relevant changesets:

osm.org/changeset/127584704

osm.org/changeset/127643552

osm.org/changeset/127682614

Posted by SHABANI MAGAWILA on 31 October 2022 in English. Last updated on 3 November 2022.

Mapping

In this diary, I’m trying to show some tips and tricks which can be used by beginner, intermediate, and advanced mappers to improve their mapping capacity and speed up mapping. Hopefully, you will learn a lot and enjoying with these simple tricks. Have fun, and you can even comment and ask in case you need further assistance and training. Welcome, all!

 Java OpenStreetMap Editor (JOSM) 

[Issue1:] How to Map Batch Orthogonal Building
In this scenario we're going to use Mapathoner Plugin in JOSM to draw a batch of Orthogonal Building. So, first, make sure you install Mapathoner Plugin in your JOSM.

[Issue2:] How to Map Batch L-shaped Building

[Issue3:] Draw a Courtyard Building

Validation

At first, many new mappers make a lot of mistakes during mapping. And, this can be caused by some reasons, such as little experience in mapping. Therefore, this part will guide them on what to do and do not, as well as demonstrate some previous mistakes done by mappers.

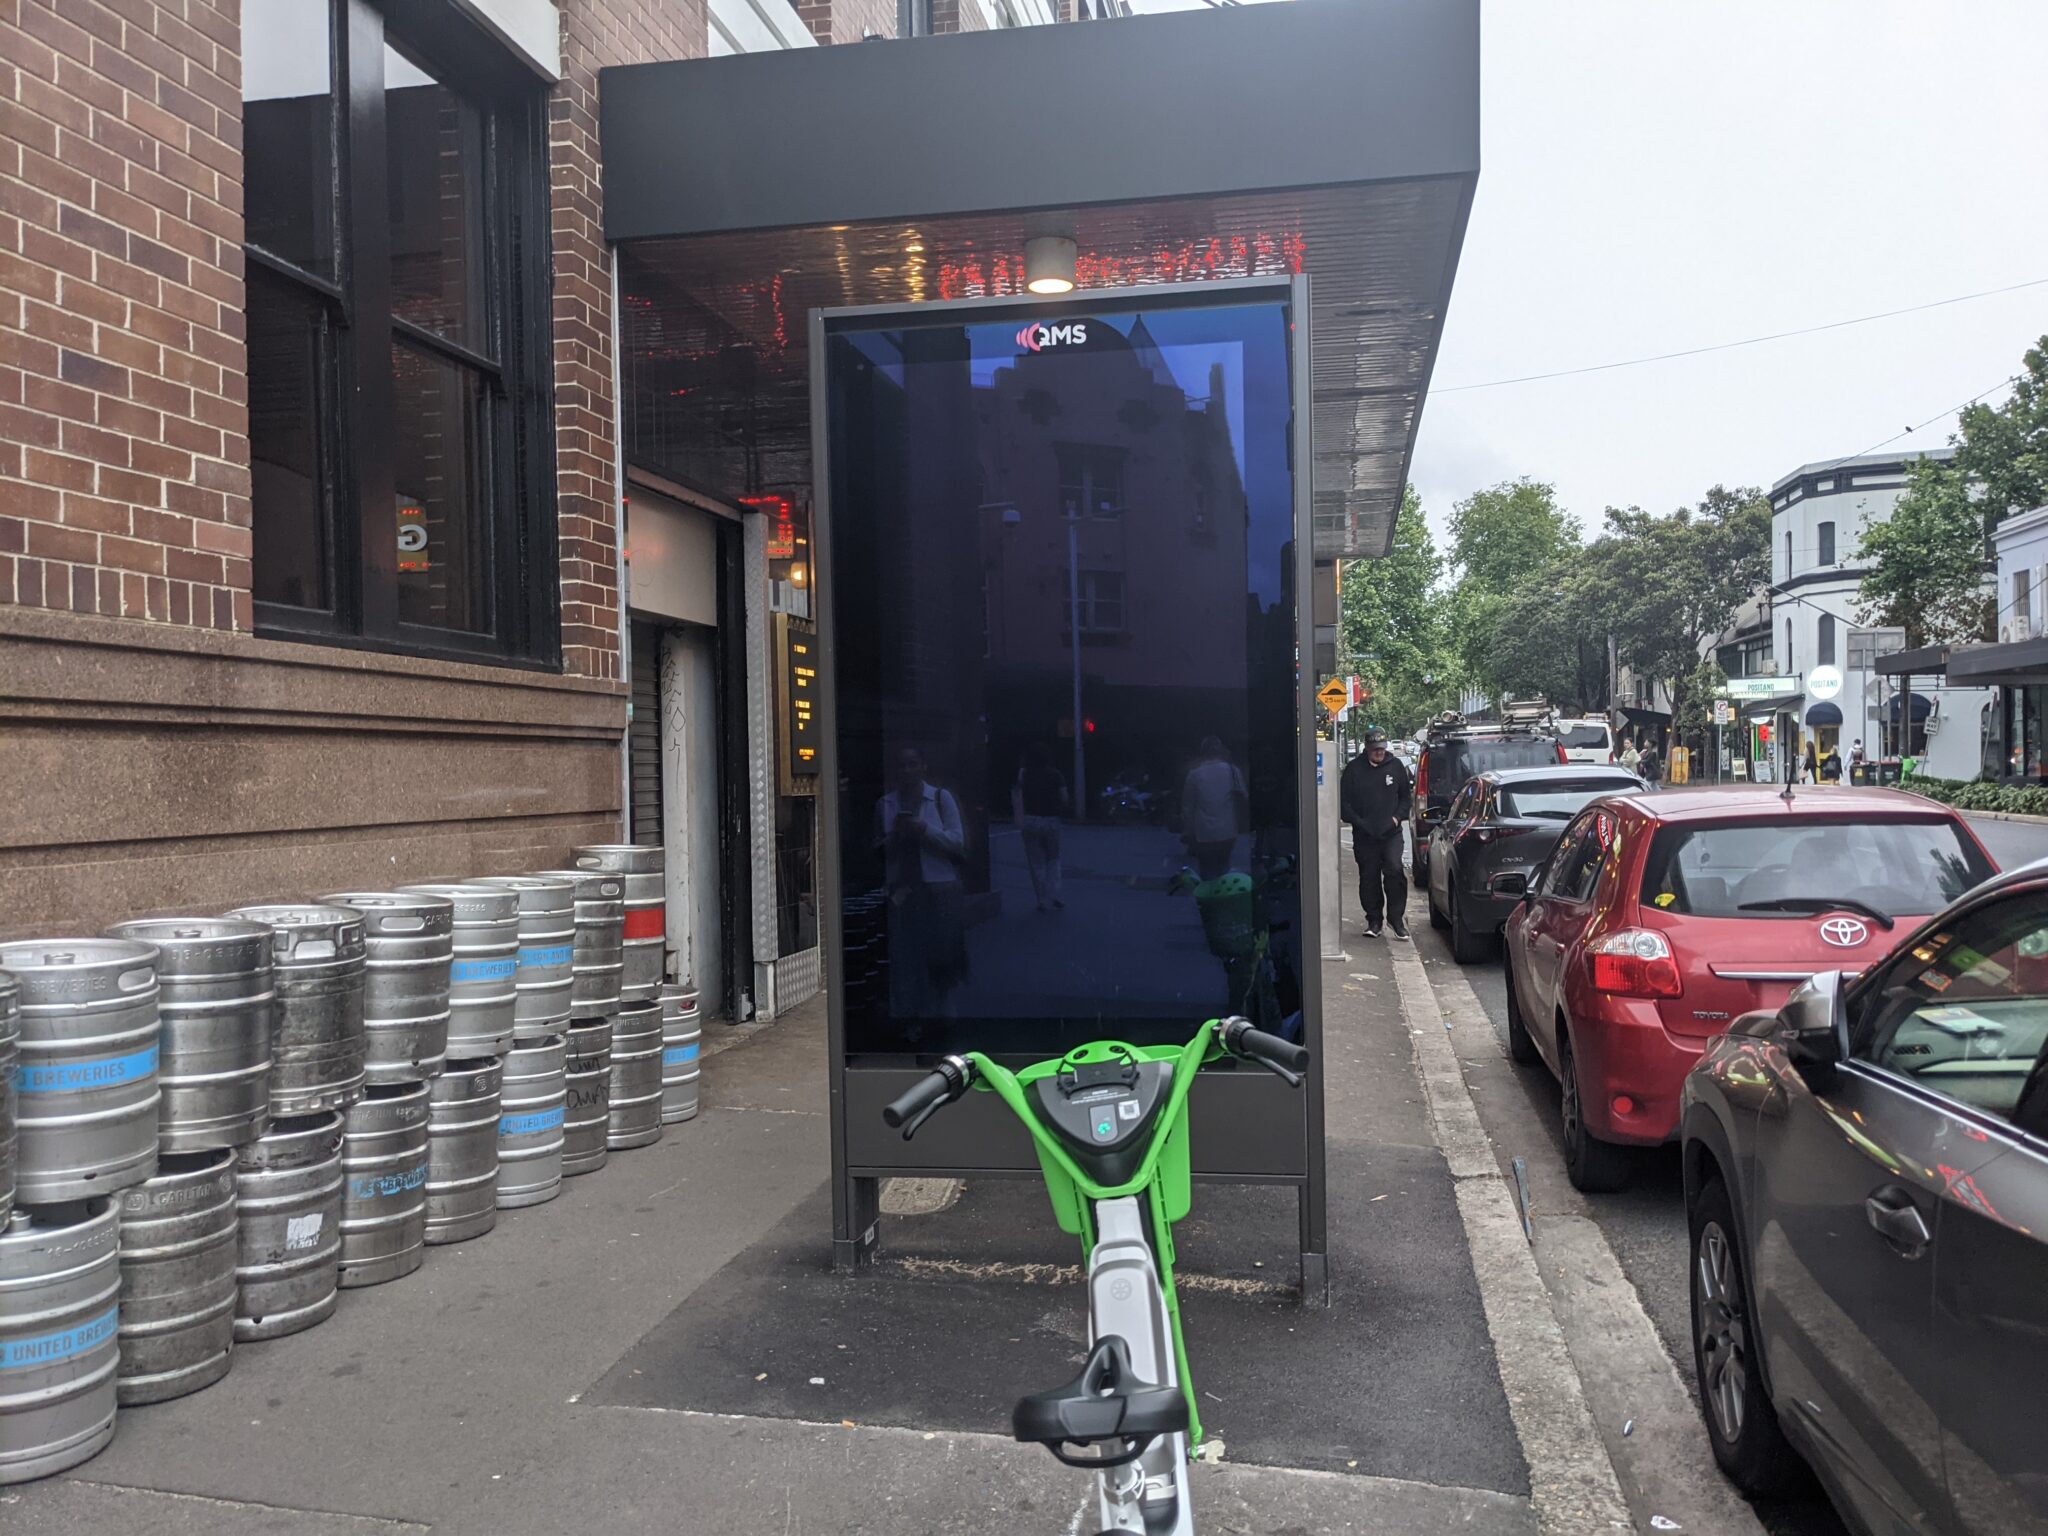
I wrote a blog post about the new advertising panels being installed in the Sydney CBD, and created a map which imports the OSM data using Overpass Turbo.

jakecoppinger.com/2022/10/mapping-sydney-billboards-a-map-of-every-qms-advertising-screen-in-sydney-with-photographs/

Through August and October I visited every QMS advertising panel. I surveyed their location and ref code to add to OpenStreetMap. I uploaded photos of many displays to Mapillary, which you can view by clicking on pins in the map.

Let me know what you think! Any feedback on improving the tagging is also appreciated.

image of ad panel

Location: Sydney, Sydney CBD, Sydney, New South Wales, 2000, Australia

(As I mentioned, I finally caught corona. Combined with a lack of energy, this is a bit shorter)

Previously…

2022 Jan. Feb. Mar. Apr. May June July Aug.        
2021 Jan. Feb. Mar. Apr. May June July Aug. Sept. Oct. Nov. Dec.
2020 Jan. Feb. Mar. Apr. May June July Aug. Sept. Oct. Nov. Dec.

See full entry

It is my pleasure to attend that event (unique mappers network Nigeria collaboration with OSM Rwanda to map Rwanda Monthly Mapathon). I have earned more skills, which will help me to improve my mapping skills so that i can edit too many features like roads, buildings and many others, which will help me to contribute to global spatial data.

Location: -1.969, 30.100
Posted by b-unicycling on 29 October 2022 in English.

As some will know by now, crannogs are my “thing” at the moment. I was hoping to produce a couple of videos about them on my channel, but it takes a bit longer to get the tag approved than expected. And I can’t tell people how to map crannogs when there is no standard.

But I digress…

While mapping buildings in Co. Cavan in Ireland, I had discovered 12 suspiciously circular features in the lakes within the last 3 weeks, and I had reported them to the National Monuments Service this week. They got back to me yesterday and confirmed 3 as actual crannogs (the rest were apparently just naturally occurring circular vegetation).

If you want to check them out, Bing or Esri Clarity imagery are best.

There are a couple more to report, but I’d rather do it in bulk than send an email every 3 days or so.

I made a quick video about it: https://youtu.be/7BJukQ8hKXw

Posted by rhythmicbalancer on 28 October 2022 in English. Last updated on 29 September 2024.

So, two of my interests are tagging waterways and highways. And of course, where they intersect, there is often a bridge. Here is how my bridge tagging method has progressed over time:

  • Bare minimum - split the highway (using e.g. aerial imagery), set bridge=yes and layer=1. This is conventional, if not particularly informative.

Then I found the National Bridge Inventory, which contains not all, but certainly many of the significant bridges in the USA. This data is quite interesting, it includes detailed info on the bridge structure and its integrity.

One can use this to verify the length of the bridge as drawn on the map, in many cases what’s shown in aerial imagery matches to within 1-2m of the specified length. You can also find data on when the bridge was constructed or rebuilt.

  • Added context - add start_date tag.

Today, I was thinking, it’s not much more difficult to add an area object for the bridge structure itself using the man_made=bridge tag. In fact, one could then move such tags as start_date and bridge:structure into the separate object.

There is also an existing bridge:ref tag which is loosely defined. Here’s my idea. What if we used the NBI structure/bridge number, where available (in the USA)? You might wonder why that would be useful. Well there is a site https://bridgereports.com, which parses the NBI database with some additional refinements, and displays a nicely formatted summary. A plugin might use the structure/bridge number to display such data.

Something like the following. For the highway:

bridge=yes
highway=secondary
layer=1
ref=KY 218

And for the bridge structure [edit: updated per discussion in comments]:

ref:US:nbi:state_code=21
ref:US:nbi:structure_number=044B00032N
structure=beam
layer=1
man_made=bridge
start_date=1978

Here’s how the metadata could be displayed (using bridge ID “044B00032N”): https://bridgereports.com/1211803

Posted by kuopassa on 26 October 2022 in English.

Not only “the mole people” live underground, as there are large urban areas, publicly accessible, built below the ground level, and indoors in general.

As an example of an indoor world: Easton Helsinki, in Finland, which has about 4.8 million visitors per annum. (Source.) It’s built on multiple levels. OpenStreetMap doesn’t yet have support for such multi-levelled maps, but it could: a level is just a layer.

Mostly underground is the bus terminal at Kamppi, in Helsinki. It has elevators and escalators carrying countless people up and down, in and out of tunnels and halls. Most of this world underground isn’t yet seen in OpenStreetMap.

Posted by WilleGIS on 25 October 2022 in English.

TL:DR River Polygons with river lines good, river lines alone bad.

Water Body digitization is the base line of water networks on openstreetmap. Every point, line, and polygon has been either manually created or generated through a computer application. Much like roads, rivers and other water bodies can be and sometimes are crucial resource for transporting goods.

Historically, cities and small towns were generally near a water body for drinking/bathing water, cargo transportation, and in the past one hundred and fifty years rivers are used for electric power generation.

Water Body Polygons are used in all types of maps so why not make these features correct by providing a more detailed polygon over just providing a line.

EX. The Sprague River in Klamath County Oregon is a perfect example of having many twists, turns, islands, and variable width across it’s path. Detailing these features in larger scales may not be as necessary as smaller scales below 1:150,000.

Location: Klamath County, Oregon, United States

YouthMappers Pre-conference meeting.

On the 18th August YouthMappers called its members to meet. This was a great moment ever for YouthMappers member to meet again for second conference since 2017. This gathering was the combination of the 2020 research fellows, regional ambassadors, YouthMappers technical supporters, director, communication officer and the board members.

The first meeting created a space for YouthMappers members to be updated, knowing one another, interacted, collaborated and above discussed the major impacts in their communities as a collective. In the process of continuity in the building of young people who define their future through community works and actively engaged in identifying problems and offering solutions, YouthMappers awarded certificates of appreciation to all its young people. This was a great motivation to Youths who tirelessly and selflessly contribute to open sources.

Highlights:

In 2022 during the conference YouthMappers @[youthmappers.org] launched the first ever documentary in history, highlighting the major impact and voices of young people inclusively. Additionally, in recognizing the efforts of young people across the #67 countries with #327 YouthMappers chapters, young people combined their voices and released the book around all sustainable development goals. This book is a true reflection of YouthMappers current, Alumni, technical team and board of directors voices. It has showcased some major impacts, works and efforts of the young people in their different communities.

The original of this post is on Discourse https://community.openstreetmap.org/t/what-happens-if-let-others-keep-sponsoring-against-openstreetmap/4343?u=fititnt .


The ad (circa 2017)

Source

https://twitter.com/sp8962/status/838676848301260800

Finances (2020, around 100x difference without need to do any core function)

Location: Historic District, Porto Alegre, Rio Grande do Sul, South Region, Brazil
Posted by amapanda ᚛ᚐᚋᚐᚅᚇᚐ᚜ 🏳️‍⚧️ on 19 October 2022 in English. Last updated on 8 November 2022.
  • Mapping
    • Keep up the regular mapping around the place, and while at SotM
    • I wish people would stop adding new man_made tags. #
  • I posted about my State of the Map 2022, which used up most of my mental OSM energy for August.
  • OSMF Board
    • Some suggestions for SotM 2023 generated some board ⇄ sotm wg emails. (I tried to do the right thing and CC the right people while communicating. This policy was adopted by the Board last year. The board member who claimed the board supported the CM bid didn’t tell the rest of the board of this).
    • Local Chapters
      • At SotM, apparently 2 groups asked a fellow board member about becoming a local chapter for Nigeria & Eritrea.
      • I got their contact details and started reaching out to them to start the process
    • Board Meeting
      • I attended the Aug 2022 Board meeting
        • I did plan to schedule an AB meeting with corp. memb.
      • also attended the Aug 2022 mid month chat, there was discussion about
        • odbl-only imports
        • prep for SotM 2022 (osmf stand, board AMA)
        • whether monthly reports from pers. comm. were needed (probably not)

(sorry if i’m missing some details, I’m trying to finish this)

Previously…

2022 Jan. Feb. Mar. Apr. May June July          
2021 Jan. Feb. Mar. Apr. May June July Aug. Sept. Oct. Nov. Dec.
2020 Jan. Feb. Mar. Apr. May June July Aug. Sept. Oct. Nov. Dec.

Social Media: 🐦 twitter: @lalonde / 🐘 fediverse/mastodon microblog: @amapanda@en.osm.town (rss feed)