 OpenStreetMap

Due to working in camp occhannock on the bay all projects are paused
Diary Entries in English
Recent diary entries
.png)
Shortly?
It was a year ago on yesterday (July 10, 2022) since I joined the OSM community. I would say it’s been nice to be a part of this awesome community that intends changing the world through open data provision.
Achieved?
- Fact that I became a part of the community of free data provision
- Meeting friends on the same endeavor in the community
On HOTOSM?
- Achieved both Intermediate and Advance Mapper status in my first year
- Mapped over 5k buildings, 100km waterways, 20km highways, close to 30 POIs, (on a close to 15hr mapping time)
It’s been GOOD

Continued working on matching OSM nodes with VSI stores. There were 6 near-perfect matches (exact same name, points less than 10 m apart), but after introducing some fuzziness to the name comparison, that number jumps to 23!
I manually inspected those 23 pairs and indeed they seem to be referring to the same business. The matching remaining in the initial 10 m matching attempt is “49th parallel cafe & lucky’s doughnuts” in OSM vs “49th Parallel Coffee Roasters” in VSI. This one requires further inquiry to see if the OSM should really be updated or not.
I’m not totally satisfied with this 10 m threshold though. It’s arbitrary and not really what I’m looking after. I think I’ll redo the analysis but using “nearest VSI business within 100 m”, so that each OSM node will always match at most one VSI store and it won’t be so strict on the distance.

We had another great OSM meetup today in Perth (Western Australia). This time we were in Fremantle, where there’s lots of 19th century buildings that need address data and business information, as well as a fair bit of clearing up confusion about where one building ends and another starts. About eight people came.
We started in the café, fuelling up with coffees and pastries, and talking about how to map, what to map, and the general semantics of footpaths and roofs.

Then we wandered around for an hour and a half or so, splitting into two groups — one went down to the harbour and found lifebuoys, statues, and memorials to seafaring immigrants — the other attempted to add more detail to the University of Notre Dame’s campus, but actually ended up mostly working on addresses, businesses, and trying to make sense of building façades.

Dear all,
Today, v5.5.0 of the OpenStreetMap Carto stylesheet (the default stylesheet on the OSM website) has been released. Once changes are deployed on the openstreetmap.org it will take couple of days before all tiles show the new rendering.
Changes include
-
Fixed colour mismatch of car repair shop icon and text (#4535)
-
Cleaned up SVG files to better align with Mapnik requirements (#4457)
-
Allow Docker builds on ARM machines (e.g. new Apple laptops) (#4539)
-
Allow file:// URLs in external data config and caching of downloaded files (#4468, #4153, #4584)
-
Render mountain passes (#4121)
-
Don’t use a cross symbol for more Christian denominations that don’t use a cross (#4587)
Thanks to all the contributors for this release, including stephan2012, endim8, danieldegroot2, and jacekkow, new contributors.
For a full list of commits, see https://github.com/gravitystorm/openstreetmap-carto/compare/v5.4.0…v5.5.0
As always, we welcome any bug reports at https://github.com/gravitystorm/openstreetmap-carto/issues

I spent most of my time today adding sidewalks in the area of Waterloo where my parents live, basically in an area boxed by Brookridge Drive, Kimball Avenue, Ridgeway Avenue, and 9th Street. There are some other areas of Waterloo that have sidewalks and crossings mapped, but they tend to be near downtown which, while useful, is a small percentage of the sidewalks that exist in Waterloo.
I actually haven’t been in the area since Easter weekend, but between the satellite imagery and my own memory I think I did a reasonable job mapping the sidewalks and crossings. I actually didn’t know about putting a node where a sidewalk/crossing and the road it’s crossing intersect until I got well into it, but I’m glad I went back and read the OSM Wike entry on Key:crossing as I hadn’t been creating the intersecting nodes until I did. I haven’t seen the results in OsmAnd yet (which is where I’ve seen crossings here in Champaign), but I’m pretty sure they’ll show up now that I’ve added them.
Admittedly part of the reason why I’m mapping these sidewalks is to direct some attention to where there aren’t sidewalks in Waterloo, but in my opinion there should be. A good example is here where the sidewalk on the north side of Park Lane ends after the Kimball Avenue access road crossing, but then starts again by Brockway Road, the next street to the west, only to end again at Colby Road. Gaps like this exist all over southern Waterloo, forcing pedestrians to either cross twice to stay on the sidewalk, move onto the street, or cut through the grass where the gap is. I’m hoping that by mapping the sidewalks I can highlight these gaps and maybe motivate people still living there to get them filled in.
Received some valuable feedback from the imports mailing list on the matters of data quality and the expectations on someone’s level of OSM experience before executing large scale automated data imports. I was pretty much well set in terms of data quality concerns, but it looks like I would need a bit more hand-holding from more experienced mappers and importers to properly execute a big import.
This is not a problem, though. It’s very reasonable and thankfully not a deal breaker to me because I chose a scope small enough that it’s feasible to execute this import manually instead of automated. In fact, my previous analysis that the VSI had about 570 coffee/café related business was an overestimation because - rookie mistake - I forgot to deduplicate by survey period.
The new numbers are:
- OSM Nodes Matching Coffee/Cafe: 574
- VSI Stores Matching Coffee/Cafe: 278
- OSM Nodes within 10 m of a VSI Store: 28
- OSM Nodes within 25 m of a VSI Store: 195
So yeah, lots of nearby matches to investigate. Now is the time to start fuzzy matching the business names and SK53 provided me some good reading material on that. It will be a bit challenging to do that with pure SQL (I’m trying to use dbt + BigQuery only for now), but I think it’s worth a try.

Foreword
I live in the St. Ann’s electoral ward of the City of Nottingham. As well as wishing to be able to improve the coverage of old_name + start_date for each street in Nottingham, I am intrigued to be able to discover when streets were laid out, metalled, drained & provided with sewers. Today that all seems normal, but I was astonished to discover that Blue Bell Hill Road had no street drainage nor sewers until the 1970s; a friend in Dowson Street has a well in their basement, whilst their road also has zero street drainage nor sewer, plus no water main through the street (water supply, sewer + drainage only at the rear of the terrace).
Like many cities in the UK, Nottingham has suffered shed-loads of physical upheaval/churn across the years. That has led to the appearance, alteration, disappearance and/or reappearance of streets and thus of street-names. I’ve recently gotten access to definitive information on (at least some of) those changes, and decided that I should strike the iron whilst it is hot. This diary is going to concentrate on local streets + national communication (rivers/canals/railways) as they apply to Nottingham City; it will also filter in items of national importance that occurred in Nottingham and/or affect the whole UK.
First, here is the OpenStreetMap Wiki on names.
Second, the principal sources I’ve been using:
I was finally able to start reconciling the Vancouver Storefronts Inventory (VSI from now on) and the OSM nodes. VSI has 578 coffe/café matches, OSM has 574. These numbers are so close, it gives me hope.
When searching from nodes in OSM that have a nearby (<10 m) node in VSI, 54 results come out. Of those, 51 are perfect matches (business name in OSM is the same as in VSI, except for things like “Starbucks” in OSM vs “Starbucks Coffee” in VSI). This isn’t too thrilling, but honestly a near 10% perfect match from the get go is pretty sweet.
Using 10 meters is pretty bold, so I’ll experiment a bit on a healthy threshold that gives me more matches but doesn’t yield too many false matches. A 25 m radius already jumps to 391 matches and a 50 m radius gives 705 which is obviously too much.
If I have the time, I should also probably start getting fancy with fuzzy matching business names to get the obvious non-identical matches out of the way so I can investigate proper mismatches.

This article is also available in Taiwanese Mandarin (台灣華語) and Taiwanese Hokkien / Taigi (台文)
The OpenStreetMap Taiwan Community (OSMTW) is pleased to receive the Wikimedia Alliance Fund for procuring two Insta360 One X2 (and accessories), as well as holding at least six Expeditions and Post-expedition Mapping Workshops from March 2022 to February 2023. OSMTW members will initiate surveys to the street-view terra incognita with a 360-degree-camera-mounted vehicle, then edit on OpenStreetMap and upload media taken throughout the exploration to Wikimedia Commons.
The path of this expedition differs from last time and headed south for Yingge, Sanxia, and Daxi rather than the Northern Coast (Keelung, Jingshan and Wanli). The “Street view car” dispatched this time also departs differently. (The vehicle author droves kick off at Hotai Easyrent Xindian, so he took a photo of the unphotographed Exit 2 of MRT Xindian District Office Station and uploaded to Wikimedia Commons before departure.)
Posted by amapanda ᚛ᚐᚋᚐᚅᚇᚐ᚜ 🏳️⚧️ on 8 July 2022 in English.

Getting familiar with the Vancouver Storefront Inventory dataset. Apparently there are around 578 businesses with names that include Coffee or Cafe/Café, which looks pretty good. Judging by name only is pretty unreliable, but at least the vast majority of the matches are in the Food & Beverages category which is reassuring.
By chance, one of these businesses is already permanently closed (according to other sources): Café Logos. It was literally the first one I randomly selected to investigate, and it’s already data that should not be imported to OSM. Oh well. This is going to be tough.
On the OSM front, today I learned how to use the BigQuery dataset that has a handy table containing the OSM areas/ways as GDAL objects, which I can use to further sub select the nodes that are inside the region of interest (Vancouver) using ST_DWithin.
My last fortnight has been spent updating the photo-URLs within these diaries of pictures that I’ve taken whilst mapping. By default the Mapillary page will normally show a small version of any photo in it’s GIS-database, whilst behind it is a map using OSM-mapping; here is an example of that, showing the front of a business called AST, as it was displayed in a 12 July 2019 diary.
In the past the owner of the photo — the person that uploaded it to Mapillary — was given a button that would give them a URL that allowed them to download the raw file of the original photograph. That was useful for webpages such as these diaries, since it allowed the photograph to be displayed. However, Mapillary has changed it’s policy on the usage of those download URLs.
At some time in the past Mapillary changed the URL format for both map-display pages & download-file pages. The original map-display URLs had the following format (1st line below) whilst the download-files were 2nd-line below (the IDs in each URL were identical for a specific photo):
https://www.mapillary.com/map/iM/<12-digit-alpha-ID>https://d1cuyjsrcm0gby.cloudfront.net/<12-digit-ID>/thumb-2048.jpg
Mapillary changed the format to the following (sorry about this):
https://www.mapillary.com/app/?pKey=<16-digit-numeric-IDhttps://scontent-man2-1.xx.fbcdn.net/m1/v/t6/<150-digit-alpha-ID>?stp=s2048x1152&ccb=10-5&oh=<61-digit-alpha-ID>&_nc_sid=122ab1
Mapillary also made 3 crucial extra decisions:
- The map URL would auto-rewrite via a 302 between the old & new format
- The old Download URL would NOT rewrite to the new
- The new Download URL would timeout after 14 days (
or maybe less) (appears to be just 2 days)
Thus, after 14 days of trawling through every relevant page & changing all relevant URLs the photos are still not showing. I’m not happy.
And here the relevant photo to see what happens:
I tried to launch JOSM for the first time in a little while & got the error:
failed to execute josm-latest no such file or directory
It had worked fine the last time I used it & had been continuously updated every since.
Searching for the Fix
An internet search did not reveal anyone reporting the same error, but did point me towards the GitHub site (more on that later, with the eventual fix at bottom of this diary post). Searching the computer did not help much, but it did reveal the .desktop menu file:
$ locate josm-latest
/etc/default/josm-latest
/usr/bin/josm-latest
/usr/share/applications/org.openstreetmap.josm-latest.desktop
/usr/share/josm-latest/josm-latest.jar
My local .desktop menu file is identical to the GitHub-code latest .desktop file. I tried running the exec-line in that file from a console (I work under Devuan, which is a Linux distribution):
$ josm-latest %U
bash: /usr/bin/josm-latest: /usr/bin/bash: bad interpreter: No such file or directory
Here is the reason why:
$ file /etc/default/josm-latest
/etc/default/josm-latest: ASCII text
$ cat /etc/default/josm-latest
# Options to pass to java when starting JOSM.
# Uncomment the JAVA_OPTS lines to enable their use by /usr/bin/josm-latest

# Increase usable memory
#JAVA_OPTS="${JAVA_OPTS} -Xmx2048m"

# Enable OpenGL pipeline (2D graphic accelerators)
#JAVA_OPTS="${JAVA_OPTS} -Dsun.java2d.opengl=True"
$ file /usr/bin/josm-latest
/usr/bin/josm-latest: Bourne-Again shell script, ASCII text executable
$ head -1 /usr/bin/josm-latest
#!/usr/bin/bash
$ la /usr/bin/bash
ls: cannot access '/usr/bin/bash': No such file or directory
$ which bash
/bin/bash
(translation): Neither josm-latest provided within the latest JOSM is fit for purpose:

Wikidata is a free knowledge base for linked open data designed to support Wikipedia and its sister projects, such as Wikivoyage. It contains over 97 million entries structured as a “Labeled Property Graph,” which is more powerful than RDF-based graphs. Like OpenStreetMap (OSM), Wikidata (WD) is an open crowdsourcing project with a large and active community.
Since 2014, OSM can be linked to WD through its tags. Currently, there are about 5.5 million such Wikidata tags with steadily growing popularity. These links can be used to create interesting products, for example a map with castles enriched with factual data from WD. However, the quality of these manually captured links in OSM is as yet unknown and untested. One must also note that the preferred way from WD to OSM - the other way around - is to use only coordinates (WD property P625) - i.e., no WD properties such as P402 are to be used because this covers only OSM relationships.
Now, two computer science students, Jari Elmer and Timon Erhart, from the University of Applied Sciences of Eastern Switzerland (OST), with the help of Sascha Brawer - a young software engineer in “un-retirement” and Wikipedian - have developed an application called “osm wikidata quality checker”. The goal was to check the existing links from OSM to WD. The errors found - for example invalid WD entries in OSM - are also sent to osmose with a suggested correction. Osmose is a quality assurance tool for detecting problems in OSM data. The goal of the application was to become an integral part of OSM’s quality assurance ecosystem. It handles the large amounts of data in the two databases (about 1.5 TB each).

Date - 07/06/22
Time Spent - 0.75 hrs
Activity:
1. Trying to decide focus of next steps. Pedestrian footpaths or Lane mapping accuracy?
2. Tried to evaluate if small improvements to pedestrian footpaths can make it easier for kids/parents to walk to school?
Notes:
Used geojson.io to create a map_potentialwalkway.geojson trace to see where a footpath trace can be drawn. More to come about this exercise.
Posted by Harry Wood on 6 July 2022 in English.
Last updated on 7 July 2022.


Next week we’re having an OSMLondon pub meet-up for the first time in a while. Or at least I am. People don’t seem to like setting themselves as “attending” on osmcal.org, but I don’t think I’ll be alone in the pub. Looking forward to it anyway!
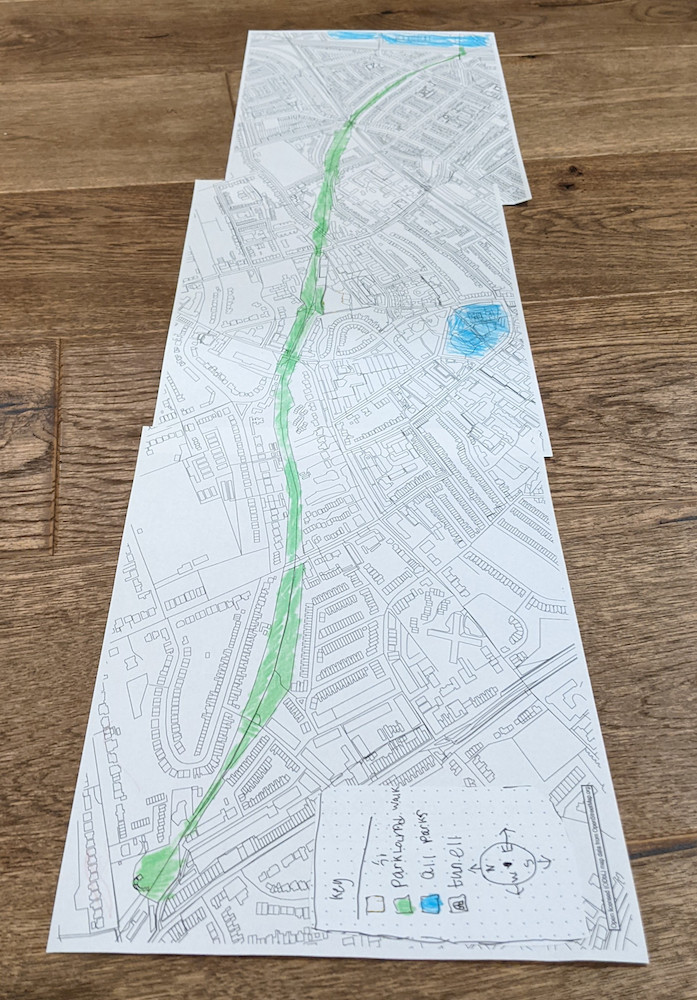
Today I wanted to print out a map of “Parkland Walk”, a local nature trail (and former railway). This was a project for/with my 6 year old son, which I spent a bit longer on than I should have today. In his class they’re doing various activities related to Parkland Walk. I thought it would be fun to give him a big map in style which he could colour in.
Posted by b-unicycling on 6 July 2022 in English.
Last updated on 12 July 2022.
I’m preparing a video tutorial on thatched buildings - it’s dead simple, but it’s an interesting topic, I thought. So I was doing a bit of research trying to learn something about local thatching traditions and came across a 1994 survey by - it turns out - a thatcher. I only came across one volume which is basically a photo album of 106 thatched buildings in Co. Kilkenny with handwritten captions given the location. Location being in most cases the townland. But because it is handwritten and because this is Ireland, I have not been able to identify all the townlands.
What I’m doing now is trying to find the townland and trying to identify the building. Most times, if there are other buildings in the picture, it is possible to spot them in the townland by comparing the arrangement of buildings. Luckily, most buildings in Co. Kilkenny are mapped thanks to our #osmIRL_buildings project. And luckily, those are mostly old buildings, so I don’t have to worry about them being built since 2019. The National Index of Architectural Heritage is somewhat helpful in that they have indexed some of those buildings, but not all. They have a map where you can find a blue dot for those marking the spot. However, they are not always correct. They also have pictures of those buildings (sometimes also the wrong ones) which I can compare to that survey/ photo album. Sometimes, rarely, because those are very rural areas, I have mapillary to work with.
If they are not too far away and accessible for a non-driver like me, I’ll go and check them out in situ, take mapillary and a photo or two for Wikimedia. #OpenData, baby!
You can kind of see on Esri World Imagery (Clarity) Beta, whether it is thatched or a slate roof, because the thatched roofs have smoother corners and the colour is a bit different.
I have an endgame in mind, which is having a complete walkability study on a bunch of major cities in the world, which competes in quality with walkscore.com but it’s fully open data.
That’s too grand for me to accomplish in a year of less-than-part-time effort. So I’ve decided to scope it down to a single city I care about, which is Vancouver. How hard can it be to analyze walkability in a single city? Well, pretty damn hard actually.
The very first thing I’d like to consider analyzing walkability is proximity to amenities like cafés, markets and pharmacies. Turns out OSM seems to have pretty good coverage on shops in Vancouver already, but for me to be very confident on my analysis the study stars with an evaluation of data coverage.
If I’m going to compare OSM with an official source, say Vancouver’s Storefront Inventory, whatever the coverage might be… I might as well import what’s missing? I think I owe OSM this much, and it will be nice to say that the whole data used in the walkability study is from OSM instead of from multiple sources.
The thing is, my past experience with data imports is limited to a single one I made for Wikidata of Higher Education Institutions in Brazil, and it took a whole month to finish it. I had more tooling available (OpenRefine is very integrated with Wikidata), more time available (5 years ago I had more energy) and the data was much more straightforward (no mapping involved, just categorization)…
Considering all that, I’d estimate it would take me about 3 months to import the whole thing following proper procedures. So I’ve decided to scope it down once again, to a subset of the data that I can reasonably scan through manually. I’ll start with coffee shops / cafés only. That I think should bring the estimate back down to a single month or so. Hopefully.
Date - 07/05/2022
Time Spent - 1.5hrs
Changeset - #123254900
Activities:
1. Focused on improving junction and road definition at Bethel Road & Pickforde Dr.
2. Split Bethel Road and Pickforde Dr. by adding nodes.
3. Added lane information for Bethel Road and Pickforde Dr. going into and out of intersection.
4. Reviewed turn assignments at junction. They look okay.
Notes:
It was difficult to understand the correct approach to mapping a junction. The OSM Wiki documentation can benefit from additional examples and best practices.