 OpenStreetMap

I have realized people map what is important to them in higher quantities than other things. Thus you find the areas they have mapped over the areas they don’t map. People map the areas the know more about than the areas they don’t, thus looking at edit clusters can show where people live. Finally the tag local knowledge as a source shows where someone has been. Combining these all together can be used to track people down.
Diary Entries in English
Recent diary entries

8098 - Uror1, Jongole State - South Sudan Floods
Since July 2019, Jongole State of Upper Nile region in South Sudan has experienced devastating flooding, which has led to millions of people displaced from their residential areas and moving to refugee camps in the neighbouring countries and within the country in search for safety and clean environment for human life.
Spent 1 hour 15 minutes mapping buildings and paths.
In the UK, the brand “Carphone Warehouse” is closing all of its standalone mobile phone branches, and only having concession stands / counters inside “Currys PC World” stores.
When it comes to adding / updating Carphone Warehouse to OSM, is there any OSM tag that can be included with a Carphone Warehouse node that’s placed on or within a Currys PC World, that indicates it is actually inside a Currys PC World? e.g. ‘is_in:Currys PC World’, ‘inside:Currys PC World’ or ‘location:Currys PC World’?
Or would placing a node on / within a Currys PC World be enough to indicate it’s inside the building?
Alternatively, would it be better to tag Currys PC World with a particular tag that indicates it contains a Carphone Warehouse inside, or even updating the name tag to “Currys PC World Carephone Warehouse”, rather than having a separate node for Carphone Warehouse?

After updating lots of opening_hours changes, as well as adding new delivery options and takeout only tags, I realized that I was missing a subset of food resources: food banks and soup kitchens.
With so many people likely not able to get to work, these resources may be more heavily relied upon than normal and knowing where these resources are, and when they are open, will be very important to people. I even added the free bag lunch, snack, and breakfast for kids from the school system.
If these resources are available in your area, but aren’t on the map, I encourage you to do the research and put them on the map!
-> https://www.openstreetbrowser.org/
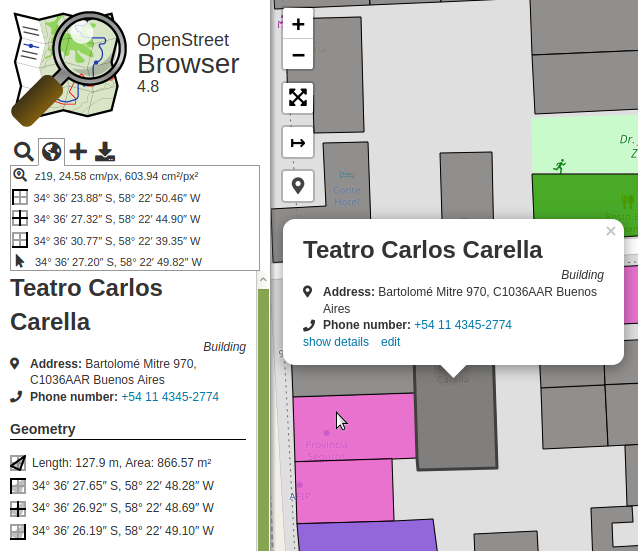
The toolbar in the sidebar now includes a globe symbol. It will show information about the current view and highlight the view center with a crosshair.
When activating GPS location, your location will be highlighted. Also, details will be included in the toolbar panel.
The details of map features show geographic information about the object: coordinates, length and area (when applicable).
In the Options you can configure coordinate formats and unit systems.
Also, in the Options you can select which editor will be used, when clicking the ‘edit’ button in a map feature popup.
For all translators: there are quite a few strings which need translation in the User Interface category.
Here in the UK, and probably most of the world, schools are closing, which means parents and students are looking for contact information for the schools. If any of them look for that data through OSM.org or downstream clients it is really useful to have that data up to date. So if anyone has a bit of time to kill, please help.
Robert Whittaker generates reports about schools, it’s a great tool to use. I don’t have time to do a proper write up, my work hasn’t closed, and is incredibly busy.
But vaguely,
- Pick an area
- Go to the table of schools matched by location
- The first link is to edubase/Get Information About Schools.
- Copy the contact details to OSM
It would be nice to also add the id as ref:edubase and the address, but I think the contact details should be prioritised at the moment. Other contact links like Facebook and Twitter would also be great but take longer to find as they aren’t part of Edubase.
I’ve done the PO and SO postcodes so far, I’ll be doing more as I can.

2020.03.21
Today marks the 366th day of continuous mapping for myself. This was a personal target of mapping each and everyday and make those blank boxes fill up in http://hdyc.neis-one.org for a year. Kind of like maintaining a streak. I tried this before however after doing really great, I lost two days in the airport because I was traveling.
Next time I start the challenge I prepared for such situations. When I was traveling to India, I used OSMAND and Maps.me and the hotel WiFi to map so no days are missing. And Finally that target has been reached. And what is more, this is a leap year so I got February 29 with me and that makes it 366 days of mapping.
Here is my profile link: http://hdyc.neis-one.org/?mmahmud
Lots of changes to our geographic landscape has been happening since the beginning of the Corona virus pandemic (COVID-19). No, the land masses haven’t changed that much but I’m guessing that your local stores may have changed their operating hours and whether or not they are doing delivery, etc. I recently brought this up on the talk-us list but I didn’t really get the discussion I was hoping for going there. So what to do?!
The question
The question I had was:
“Do we change all of the information that we know to no longer be true and ‘fix’ it, if only for it to be a temporary fix for what we all hope will end up being getting back to normal?”
It’s a hard question to answer. Many of us have invested lots of time collecting this original information that we certainly hope we will be returning to soon. On the other hand, we know that the information that is currently on the map is incorrect and is no longer useful to our end users.
The answer?
For me, the answer was to update the businesses with what we currently know to be correct. This means that going out and resurveying a lot of businesses in my area and attempting to gather the new operating hours, whether they are doing takeaway only and maybe they have started doing delivery (this goes for grocery stores as well!).
To me, this is all about serving my community and trying to provide near real-time information to people that need it. OSM isn’t just a bunch of lines on the screen, it’s a place to find information about what’s going on around you and help you find what you are looking for when you are looking for it.
I think we all hope that everything we knew before the pandemic is still what will be after the pandemic, but we simply don’t know.
What this means for me (and other cartographers like me).

English version:
Amazon has been an active contributor to OpenStreetMap (OSM) in Germany for over a year now. The drivers of our delivery service providers at times encounter problems where OSM data is not matching with on-ground reality (e.g., where the map suggests a left turn, but the left turn is legally restricted as per the street signs). These discrepancies are reported by the drivers, but due to absence of ground truth (street images), we are unable to investigate and rectify the map defect in OSM. These defects risk the safety of not just drivers of our delivery service providers, but all users who might be using OSM as a base map for navigation purposes. In order to overcome the lack of ground truth in Germany, Amazon has signed up for a short term contract with CycloMedia Technology B.V., a private street imagery provider. Details about CycloMedia can be found here.
How are we going to utilize the data?
Amazon will investigate the locations of feedback shared by drivers spread across Germany using CycloMedia street images on CycloMedia’s web-access portal. The images will be mainly used to add restrictions related to turns, access, directions, weight, and height to improve OSM map data. When making these edits on OSM, we will attribute the anonymized source of the image along with its date of capture. Additionally, staying true to maintain the quality of data in OSM, Amazon will contribute edits to OSM directly only when we have a street image of 2019 (or more recent). However, when we find images of 2018 or older (which reinforce the feedback from the driver), Amazon will share notes or create map roulette tasks. In these situations, we request support from the German OSM community to confirm the ground reality before making an edit. Furthermore, any comments on these changesets from the community members will be taken up on priority and responded to at the earliest.
What images are we using?

Today has been my first day of contributing to OSM. My hometown is still as good as empty, so I have a lot of work to do. I already added several POIs (mainly shops) and put some roads where they’re supposed to be. I have a lot to learn, but I already got a lot of help to get started. My goal is to rival Google Maps in completeness in about a 1 km radius from where I live.

Dear all,
Today, v5.0.0 of the OpenStreetMap Carto stylesheet (the default stylesheet on the OSM website) has been released. Once changes are deployed on the openstreetmap.org it will take couple of days before all tiles show the new rendering.
Changes include - An update to Lua tag transforms, setting line vs polygon decisions for new tags
-
Added upper way_area limits to most features using ST_PointOnSurface to avoid performance problems from large polygons
-
Moved MSS files into their own directory
-
Removed rendering of power=cable features
-
Removed overlay pattern for natural=sand
-
Reduced landcover fading at mid-low zoom levels
-
Removed rendering of barrier=kerb
Thanks to all the contributors for this release.
For a full list of commits, see https://github.com/gravitystorm/openstreetmap-carto/compare/v4.25.0…v5.0.0
As always, we welcome any bug reports at https://github.com/gravitystorm/openstreetmap-carto/issues

I took a trip to Dubuque, Iowa the weekend of Feb 28 to March 1, and have just done quite a bit of editing during that trip. I didn’t just travel to and from Dubuque, but also along some of eastern Iowa’s expressways, including U.S. 151 from U.S. 61 to IA 13, then north on IA 13 to U.S. 20, then on U.S 20 all the way to I-39/U.S. 51.
I’ve got the addition of info for that round pretty much completed, minus some of the maxspeed tags on U.S. 61/U.S. 151 in Dubuque. All the sections marked as trunk except for a small part of U.S. 20 between East Dubuque and Galena are also expressways, so I added the expressway=yes to these parts. In the section I mentioned I used expressway=no for the first time since there are driveways straight to peoples’ garages in that section, which is on the eastbound part only.
I have more to do regarding Dubuque itself. One of the places I used to hang out at when I lived there, Monk’s remains unmapped. I don’t know why I didn’t change this back in 2013, but I have the means to change it now, and I’ll do it later. Also there’s a lot of cycleways and footways in the new Bee Branch Creek area that are currently unmapped. I have the GPS traces to do most of the mapping, but it’s really better handled by someone who currently lives in Dubuque. Nevertheless I plan on doing it if no one else has already.
One thing I’ve also been concentrating on is minspeed tags. Both Iowa and Illinois have minimum speed limits on all Interstates and most non-Interstate freeways, mostly for keeping farm equipment off of them; the freeway sections of U.S. 20 in both Iowa and Illinois are examples of the latter. Minspeed tags don’t get the attention that maxspeed tags do, so I’m doing my part to change that.
And I haven’t forgotten the other mapping I’ve yet to do from my previous entry.

On 15th March, 2020 Unique mapper network Nigeria had a webinar for planning .
The youthmappers team #Oyomappersteam exco had discussion with Jenny on polio project in Oyo State.
interesting, looks like these sat takes are pretty current!
Posted by netznarkose on 16 March 2020 in English.
Last updated on 21 March 2020.

Black delight
7026 - Missing Maps: Mapping buildings in Nangha Boguila - Ouham , Central African Republic
In and around Bossangoa in the Central African Republic, MSF teams provide consultations in hospitals and health centres, and support a network of community health workers. A better map of the region will help the teams to understand the exact situation in the area and will allow them to make rough population estimations.
Spent 1 hour mapping buildings in various sectors.
Dear OSM Community,
At Amazon, we have observed that ~94% of gates mapped in OSM do not have access information updated (based on study in Florida). This poor coverage of gates lead to routing issues such as allowing general public to restricted areas; specially to gated communities (find the below example for reference). We plan to take up the task of updating the access information for gates in the US.
 OSM link: osm.org/#map=16/27.3912/-82.4276
In the above example highlighted polygon contains a gated community with 3 gates situated at three different places. Red points indicate restricted access (residents only) and green point indicates access allowed for general public/ deliveries along with the local residents.
How will we get the access information about gates and add it to OSM?

For the past 10 months, I have been without a reliable net connection, which has precluded any OSM work. I am slowly restoring that service, and hope to resume soon. The cause of this was a common occurrence, and not one I enjoyed, nor do I want to expand about it. Onward !
 indoor= is a new rendering of OpenStreetMap’s indoor data. It displays the building’s floors, level by level.
When at a proper zoom level and centered on an indoor mapped building, the indoor data of each floor and the list of the levels will be displayed. The level selector allows you to change the displayed floor.