Diary Entries in English

Recent diary entries

Originally published here: https://atakua.org/w/landcover-conflation-unsolved-issues.html

This post continues where the previous one left off.

After some time spent on processing and importing land cover data, I have several ideas on how to further improve and streamline both the import process and in general work with land cover features in JOSM.

Suggested tools to help with land cover data

Certain typical tasks arise over and over again when one works with polygons meant to represent land cover, regardless of whether they are imported or manually traced. At the moment there are no adequate tools in JOSM to assist with such tasks.

The trick here is not trying to find an exact geometric solution to the tasks at hand, but rather imitate what a human would reasonably do to finish such a task. And a human would cut corners, allow some inexactness traded in for speed of completion.

Floodfill tool

A common task is to fill a gap between two or several polygons. An example would be to map a new farm field situated between several forests or clammed between several intersecting road segments. Currently one has to carefully trace a new way along the existing borders, either reusing nodes or leaving a small gap between the new ways and adjacent ones.

The idea here is similar to pouring a bucket of paint into the middle of the empty area and then letting it spread out naturally to fill the empty area. The paint will then spread out until it hits borders, or until it runs out of paint.

The same approach can be implemented in a tool that starts from a single node (or rather, from a tiny closed way) which then grows in all directions. Its growth is stopped when a segment of the new way hits a boundary in a form of an existing way. Optionally, the new way can then snap to existing way there.

See full entry

Introduction

This is the second post made regarding the Google Summer of Code 2019 progress. The first month is coming to an end and with it, the first 2 tasks as well. In this entry I will present what is new and what has changed, in regards to the first task as well as the work and decisions made on the second one. Exported images of demo renderings are also included at the bottom of this entry. You can see all the changes mentioned below in the pull request here
So, let’s begin:

Minor noteworthy changes on the 1st task

If you happened to follow my previous diary entry as well you may have noticed that it was mentioned that “Depending on their importance, I may include a brief of them in the next diary post”, referring to additional changes. Major ones are presented in the next paragraph below but I chose to also include the ones listed here; although they may not directly affect the flow/functionality of the program they still do play their role.
What is new:

  • Javadoc is created in important parts of the code such as the configureMaterial() method in TrafficSignModule and the File field in both TextTextureData (TTD) and ImageTextureData. The later Javadoc addition is to demonstrate the major differences these fields have despite their overall similarity.
  • Getter functions have been removed from TTD and its fields have been made public, following the concept of its parent superclass TextureData.
  • "osm2world" is now appended to every prefix of a temporary image created in TTD getFile() method as a way to help users understand where those new files in their systems came from
  • Last but not least, the hashCode() and equals() methods are now only defined in the TTD and ImageTextureData child classes instead of the TextureData parent one. Prior to that, an ImageTextureData object could be deemed equal to a TextureData one, as they used to bear the same fields, which should obviously not happen.

Major changes on the 1st task

See full entry

Posted by omgitsgela on 26 June 2019 in English. Last updated on 27 June 2019.

Did you just get a Chromebook, and excited to get mapping with it? You can run JOSM on Chromebook with a little bit of effort. This guide was written for ChromeOS 74.0.3729.159 and up and relies on the Debian Stretch 9 emulator Crostini. As you’re entering these commands, you can copy and paste them from the website to the Debian terminal by using a right click (or Alt + Click if you don’t have an external mouse connected)

Step 1 - Enable Linux Apps

Open the Settings app, and search for Linux. Click “Turn On” to enable Linux support. On the popup installer, click Install. Sit back and wait. When the installation is complete, a Debian Linux shell terminal will automatically open.

Step 2 - Add the JOSM repository

This command adds the JOSM repository to the sources list. echo deb https://josm.openstreetmap.de/apt alldist universe | sudo tee -a /etc/apt/sources.list

Download and register the OpenStreetMap public key. wget -q https://josm.openstreetmap.de/josm-apt.key -O- | sudo apt-key add -

Step 3 - Update the APT repositories and install

This will query updates to all packages, and install josm afterwards. This will take quite some time. Go grab a coffee. sudo apt update ; sudo apt install josm

Step 4 - Run JOSM

Open up JOSM within the App Folder “Linux Apps” from the launcher. It’s possible that JOSM could have too small a font to read on your screen. The fix is to install Java 11 and use UIScaling to render the applet with a larger font. If you wish to fix this and give JOSM a larger font, follow the next steps:

Optional Step 5 - Enable Backports

Debian Stretch doesn’t come with Java JDK 11 by default, but we can enable it by adding the backports software repository.

echo deb http://deb.debian.org/debian stretch-backports main sudo tee -a /etc/apt/sources.list

Optional Step 6 - Install JDK 11

See full entry

Originally posted here: https://atakua.org/w/landcover-conflation-practical-issues.html

This is the third part of summarizing my experience with conflation of land cover data for Sweden. More examples of practical problems and ways to address them follow.

The same or similar problems may or may not arise during other imports of closed (multi)polygons in the future, so tips and tricks to save time will become handy. Note that some points from the previous part may be repeated here, but with more thoughts or ideas on how to address them.

Why bother with land cover import

The general idea of importing any data into OSM is to save time on doing the same by hand.

Classic data sources for the OSM contents are:

See full entry

Hi to all,

I would like to introduce myself and share my interest of being part of HOTOSM board.

I have had the privilege to participate in various projects involving Humanitarian Mapping. As a volunteer I have been representing OpenStreetMap and HOTOSM in different forums and I am Co-Founder of the Geochicas initiative in the one we want to impulse more female presence in Geospatial technologies and increase the number of women adding Open Data in OpenStreetMap.

Most recently I participated as HOT volunteer in Guatemala. HOTOSM Team was supporting the Clinton Health Access Initiative and the Guatemala Ministry of Health to assist local technicians who are in the field all year fighting diseases such as Dengue, Zika, Chingkonkuña, and Malaria in the area of Escuintla. HOT arrived in Guatemala to support the Ministry of Health with the use of Open Data Kit (ODK) and OpenMapKit (OMK) in order to have a more detailed census and action plan using open source tools so the goal to eliminate malaria can be tracked and achieved by 2020. I participated in the training activities with the HOTOSM team.

Since 2014 I became fascinated with HOTOSM and OSM when I realized all the potential it could have to change people realities and how we can improve their lives so I started getting involved in the Open Data and Open Mapping world. In 2016 on behalf of HOTOSM I received the honor of being one of the 50 Digital Leaders of Mexico and last year INEGI (after a few years of exchanging communication with them) invited OpenStreetMap Mexico to be part of the Consulting Council to be able to review their strategy and tools before launching to the public.

See full entry

Posted by apm-wa on 25 June 2019 in English.

Ann and I have returned to the United States. I am presently uploading the last several thousand Mapillary ground-level images from a series of trips around Turkmenistan made in my final weeks in country. When they are uploaded, that will be it for local imagery collection
:-(

I still have a few loose ends to tie up, including full analysis of geographic name changes, now documented at Turkmenistan Geoname Changes, plus full analysis of the Soviet military maps currently en route to our home in our sea freight from Ashgabat, and of course a fresh writeup of how to generate wall maps using a combination of Osmosis, Maperitive, Inkscape, and Corel Photo Paint. These efforts will compete with the need to effect some urgent repairs to our house, which we have not occupied for 16 years and which our tenants of course rather neglected.

Location: Lake Barcroft, Fairfax County, Virginia, 22041, United States
Posted by Carnildo on 24 June 2019 in English.

Disclaimer: I am not an OSM website developer. All information here was obtained by looking at the OSM GitHub repository and poking at the OSM website.

There’s been some controversy recently over the contents of the OpenStreetMap robots.txt file. I think it might be informative to look at what the file actually does.

Allow: /user/

This does nothing. “Allow” lines in a robots.txt file permit the crawling of URLs that would otherwise be denied, but there’s nothing in the file that would deny the /user hierarchy.

Disallow: /traces/tag/
Disallow: /traces/page/

These are various alternate ways of searching the GPS traces that have been uploaded on the site. The main trace listing is still accessible.

Disallow: /trace/

This is the API endpoint for accessing GPS traces. It is not intended to be displayed in a web browser, and contains nothing useful for a search engine.

Disallow: /api/

This is the API endpoint for editing the map. It is not intended to be displayed in a web browser, and contains nothing useful for a search engine.

Disallow: /edit

This is the URL for the in-browser editor. Everything under this URL is behind a login barrier, and it contains nothing useful for a search engine.

Disallow: /message

This is the URL hierarchy for the on-site PM system. Everything under this URL is behind a login barrier, and it contains nothing useful for a search engine.

Disallow: /login

This is the above-mentioned login barrier. It contains nothing useful for a search engine.

Disallow: /history

This is the visual history browser. The contents change far too rapidly to meaningfully index on a search engine.

Disallow: /geocoder

This is the on-site search system. Search engines searching search engines never ends well.

Disallow: /browse

Disallow: /*lat=
Disallow: /*node=
Disallow: /*way=
Disallow: /*relation=

See full entry

This was originally posted here: https://atakua.org/w/raster-to-vector-landcover.html

The whole premise of the land cover import for Sweden [1] bases on the idea to take the raster map of land cover and to covert it into the OSM format. This results in new map features that are essentially closed (multi)polygons and tags. These new features are then integrated into the existing database with old features during the conflation step.

This post is about the first steps of this process, everything around the vectorization of raster.

Data flow overview

It is hard to describe all the programmatic and manual actions needed to convert the input data. A lot of it is described in the OSM wiki page [1]. The best way to learn the details is to look into the source code of scripts written to achieve the goal. However, the general data processing flow will definitely contain most of the following phases, and maybe something more. The order of certain steps, especially filtering phases, can be different. Coordinate system transformations are only needed if the input data is not in the WGS 84 format used by the OSM database. It can also be done later in the process.

  1. Change coordinate system of data
  2. Filter the input raster file to remove small “noise”
  3. Remap input raster to reduce number of pixel classes
  4. Mask the input raster with a mask raster generated from existing OSM data
  5. Split te single raster file into smaller chunks i.e. tiles
  6. Vectorize the raster data into vector data
  7. Assign OSM tags to vector features, drop uninteresting features
  8. Smooth the features to hide the rasterization artifacts
  9. Simplify the features to keep size of data in check
  10. Do automatic conflation steps that take both new and old vector data into the account. Examples: cut roads, snap nodes, delete insignificant features etc.
  11. Do manual conflation steps that could not be automated.

Raster masking approach

See full entry

Posted by tshedy on 24 June 2019 in English.

I am a physical planner, working for the Government of Lesotho. I am an experienced GIS user within a very focused context of laying out sites for human settlements. I am very committed to open things, whether that is opendata and this includes OpenStreetMap, and also opensource approaches to solving the problems of measurement, scale and needs. My HOTOSM record as a mapper dates back to 2015, and in these 4 years I have grown to understand that HOTOSM is the most important humanitarian platform when it comes to supporting logistical responses to disasters. I have also noticed that, while not fitting into the “crisis mapping” definition other HOTOSM projects have the capability of recording and documenting environmental damage and other larger scale threats caused by climate events, and in particular I was a big contributor to the #MapLesotho mapping tasks supported on the hotosm tasking platform.

Alt Tshedy

See full entry

Started experimenting with some early morning explorations in Hyvinkää. Nice to check around forests, the railways, industrial yards, and possibly defunct old buildings. You could call it urbex. Definitely. Sometimes I got the camera / mobile. Looking for good mapping clients (Apps) for Android.

Location: Kittelä, Hyvinkää, Helsinki sub-region, Uusimaa, Mainland Finland, 05840, Finland
Posted by Richard on 22 June 2019 in English.

Potlatch gets fewer new features in a year than iD does in a day, but occasionally something creeps through.

This week/month/year, that’s the ability to add a function key shortcut (F1-F4) to a relation. Open the relation dropdown menu in the advanced relation panel, choose “Assign to F1” (or whatever), and from then on, you can add the current selection to that relation by pressing the key. It’s particularly useful when building route relations.

Function keys can, of course, also be used for memorising tag combinations and for switching between background layers.

Dear HOT members

Thank you for taking the time to read my candidate statement. I’d like to take this opportunity to outline my previous involvement with HOT (and the broader mapping community), experience to date and outline particular areas of interest which I believe may be beneficial to the broader community.

But first, I’d like to thank Melanie Eckle for the kind nomination and her guidance in the run up to making the decision to run for the Board. I’d also like to thank the others from the community who’ve fielded questions and offered support as I’ve explored putting myself forward

Why HOT

I firmly believe in the power of people and technology to drive positive social change. As such, I’ve been incredibly fortunate to spend several years working around the world on various ‘Tech for Good’/ ICT4D projects, alongside good people doing incredible things. However, there have been frustrations. Too many times I’ve seen organisations inform rather than involve communities in the solutions, resulting in poor solutions - most worrying is that (with good intentions) they often implement solutions which were deemed ‘good enough’ for the community where it was implemented, but wouldn’t be upto the standards the implementers demand themselves. I’ve also seen communities disempowered more broadly through the type of engagement and solutions escalate into costly projects which need to be maintained.

As such, when I came across HOT (via Missing Maps) I was genuinely inspired by the following:

See full entry

Posted by Jfact0ry on 21 June 2019 in English. Last updated on 23 June 2019.

Getting Alaska’s National Hydrography Data into OpenStreetMap

The current coastline in OpenStreetMap is lacking in detail for much of Alaska, particularly the very coastal, Southeast Alaska.

Jaggedy coastlines

Myriad Islands - as they appeared in OSM June 2019 (-136.209, 57.634)

I’d like to use National Hydrography Data to improve the entirety of Southeast Alaska in OpenStreetMap. Here is a side-by-side comparison map that shows current OpenStreetMap data (as of 2019-06-07) with NHD data.

OSM / NHD Comparison

The coastline has been my particular interest ever since I started editing the map.

See full entry

Location: Sitka, Alaska, 99835, United States

Dear all Hot Members,

First of all I would like to thank Jorieke for nominating me as a candidate. It is surely an honor for me whether I am being elected or not and it will surely encourage me to contribute my furthest best in HOT moving forward in coming days. Thanks to Pete Masters & Ahasanul Hoque for considering me & encouraging for the candidacy.

Involvement with HOT & OSM:

It has been now almost 05 years I have been walking with HOT & OSM. Supposed to be helping out in a MissingMaps piloting project as a translator, instead fell in love with mapping itself! In a very short period of time got involved in the community building process, promoting & supporting OSM based projects & initiatives in Bangladesh. I have been one of the core contacts of HOT & MissingMaps in Bangladesh for a while now. Have been granted voting membership since 2017 & being involved in several working groups. The journey has been surely an eventful one and I’m loving the ride.

See full entry

Posted by WoodWoseWulf on 21 June 2019 in English. Last updated on 12 July 2022.

It’s been three years since the launch of Niantic’s Pokemon GO app, a lifetime in the online world. After all this time, there remains a certain frustration and tension between Open Street Map (OSM) volunteer mappers and a subsection of Pokemon GO trainers who seek to edit the map in order to enhance or even cheat their game experience. At least in part, this is caused by a series of misunderstandings about the OSM project, Pokemon GO and the relationship between the two.

Several guides exist for budding Pokemon GO mappers, such as osm.wiki/Tips_for_new_(Pokemon_Go)_mappers. However, there are scarce resources aimed in the other direction, that is to say, guides to help mappers understand the motivations driving trainers to make changes to the map, and ways to understand what kinds of changes said trainers are likely to want to make.

Glossary

Some of the terms I will use here may be unfamiliar to mappers, so I will define them here.

EX Raid/EX Eligible:

EX Eligibility is a special characteristic of certain Gyms (see POI definition below) that allows that Gym to occasionally output invitations for a local event in which trainers can obtain a rare Pokemon. (See “EX Eligibility” sub-section below for more detail)

Biome:

A term used by the Pokemon GO community to describe locations where certain kinds of Pokemon might appear. For example, proximity to a water biome might result in more fish like Pokemon and forests might attract more bug-like and plant-like Pokemon. Niantic occasionally refers to biomes as “habitats”. (See “Biomes/Habitats” sub-section below for more detail)

Blocked Area:

An area where Pokemon are forced to stop appearing.

Nest:

A preset area on the map that has an increased occurrence of a particular kind of Pokemon. These change species of Pokemon on a two week cycle and also occasionally when in-game events start and end. (See “Nests” sub-section below for more detail)

POI:

See full entry

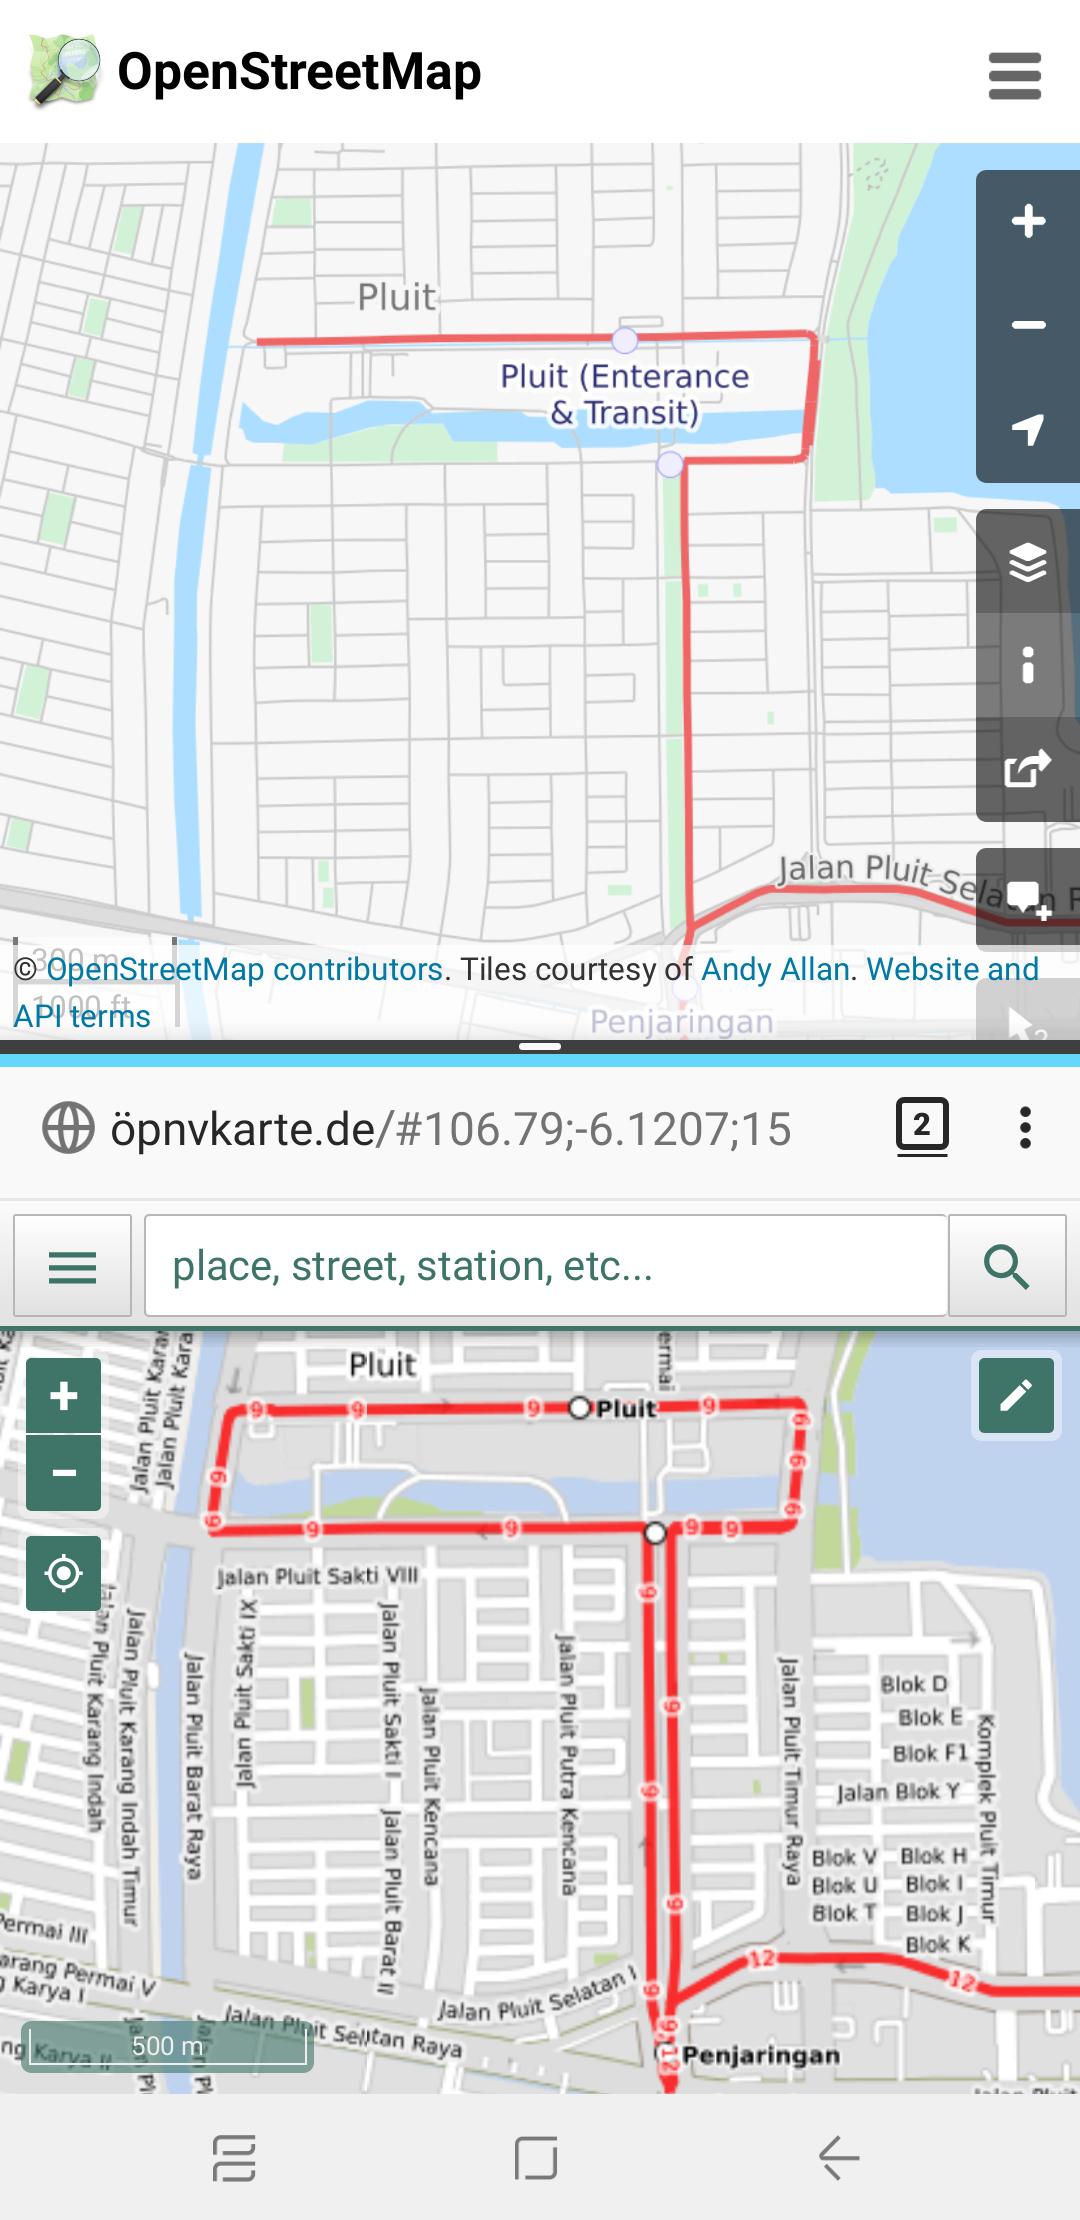
I am currently working to improve Transjakarta, one of Jakarta’s major BRT/Busway operators, to comply with Public Transport Version 2 schema in OpenStreetMap, though Version 3 is being purposed.

image Before and After map of Transjakarta Corridor 9 route, between Pluit and Penjaringan bus stops

Legacy Tags that I’d like to keep for compatibility:

  • amenity=bus_stop for PTV1 compatibility on bus stations
  • corridorXX=yes: assigns which Transjakarta corridors are served, such as corridor9=yes for Corridor 9 and corridor12=yes for Corridor 12 (see Implementation Notes if you are a developer utilising this tag for queries)
  • HOTOSM InAWARE tags
  • network=Transjakarta, now also reinforced withnetwork:wikidata and wikidata values
  • shelter=yes
  • shelter_tj=yes (see Implementation Notes if you are a developer utilising this tag for queries)

Things I REMOVED

See full entry

Location: RW 04, Pluit, Penjaringan, North Jakarta, Special Capital Region of Jakarta, Java, 14440, Indonesia
Posted by Mahede Hasan on 20 June 2019 in English. Last updated on 24 October 2019.

It was 2014 when I was coming back to Dhaka the capital of Bangladesh where I study.I was travelling with my few friends and one of my best friend was using mobile application map to see our GPS location and to know our route distance from the current position.It was just amazing to me.After two years back,I got a chance to take training on Map which was actually OpenStreetMap but Unfortunately missed the chance due to my personal problem and in February 2018, I took training on OSM from Bangladesh Humanitarian OpenStreetMap Operational Team (BHOOT) and Youth Mappers Dhaka College(YMDC).Now I am working a lot in this platform and want to continue my effort as soon as possible.

Mapping Like a game!Yes.This is a game where I want to complete my target and to be winner.In very first time of my journey in this platform, I saw that my own locality was not mapped and got a chance to map that area and now this area is mapped with lots of POI data along with valuable information.

This is a long journey, I want to continue my journey on this platform.I have a several plan for implementing my own area using OpenStreetMap. I will give thanks to BHOOT and YMDC for giving me this awesome opportunity to be skilled on OpenstretMap platform.

Nowadays the world is being interested in GEO based information where OpenstreetMap can a major platform for it’s copyright system cause we know this platform is totally open for all.So why anyone can add or export data for his own interest. I want to do my journey long with this platform ant will try to be one the best contributor.

Happy Mapping!!!

A couple of weeks back, I was aimlessly panning around the Philippines in the OSM.org website and saw Banton island right at the center of the archipelago north of the Sibuyan Sea. I loaded the data in JOSM to check what was actually mapped in the island. It looks like it has decent coverage for roads and very few buildings. So I started adding a few buildings here and there and then it struck me, what would it take to systematically map the whole island remotely?


Banton Island in Romblon as viewed from a pump boat arriving from Marinduque. Photo credit: Lawrence Ruiz, Wikimedia Commons

This quest has begun …

Choosing the imagery

First, I checked if there are good imagery available other than Bing, I found that DigitalGlobe (DG) Premium and Standard looks more recent compared to Bing. Some areas are cloudy in Premium while clear in Standard and vice versa. I figured I can interchange these two depending on where I am mapping.

See full entry

Location: Apayang, Hambi-an, Banton, Romblon, Mimaropa, 5515, Philippines
Posted by pedrito1414 on 19 June 2019 in English. Last updated on 30 June 2019.

I am just finishing my first two-year board term for the Humanitarian OpenStreetMap Team and am running for another two years. This diary is written to tell HOT voting members why, so that they can decide whether to vote for me or not…

Priorities for another term

Having spent the last couple of years meeting and talking to people, reading documentation, attending board meetings and discussing ideas and issues, I have a much better understanding of where we are strong as an organisation and should double down and where we are weak and perhaps need to focus more. These perspectives have some very pragmatic implications in terms of where I would prioritise my time if I were re-elected… I would like to take you through the top two of those priorities…

Firstly, I’d like to make sure that HOT strengthens the expertise and skills necessary at board level for an organisation of its size and ambition. Secondly, I’d like to contribute to a movement within HOT to reconnect the organisation with its members, creating more opportunities for meaningful contribution from the diverse communities they represent.

Strengthening our governance

On the priority number one, we have already started to take concrete steps towards recruiting an advisory board. This idea was first floated years ago and when I joined the board I was actually against it. I thought that it would move HOT away from its model of community governance. Now, I don’t - I think having a strong advisory board will allow our community-elected board to be more focused on leveraging data and mapping to support people in crisis and the HOT community itself.

See full entry

Posted by Amna A on 19 June 2019 in English. Last updated on 24 June 2019.

Last summer I was deployed for the Humanitarian OpenStreetMap Team (HOT) Uganda project and wanted to share an account of some of my time in the field.

My past two years working on global health and development in the epicenter of the field - Washington, D.C. - gave me a good understanding of the refugee crisis and the problems faced by displaced populations around the world. Or so I had thought.

There are currently estimated to be ~1.4 million refugees in Uganda. It is here that, after a 25 hour flight with two layovers and multiple anti-nausea tablets, I arrived, eager to work with the Humanitarian OpenStreetMap Team (HOT) to promote the mapping of refugee environments for humanitarian purposes.

I spent my first few days getting oriented in the HOT office in Kampala, and thoroughly enjoying all the city has to offer (rolex stands need to make their way to the States, pronto!). We then headed north to Arua where the huge settlements of Rhino and Imvepi are located.

See full entry

Location: Isakua, Arua City, Northern Region, Uganda