Diary Entries in English

Recent diary entries

Posted by Polyglot on 6 March 2019 in English.

I started by installing the QuickOSM plugin.

I clicked on the green looking glass in the new toolbar that appeared.

Query

Key: highway In Brussels

Run Query

It downloaded every highway in the zip code 1000 Brussels.

Now I want to show labels for the street names.

On the middle layer (the one with a horizontal line), I press right mouse button, then Styles / Add,

named it Streetnames.

Right Mouse Button on the layer, then Properties.

Labels

Single labels

Label with: abc name.

Size 7.0000

Color: Blue

On the nodes layer, remove all those red dots by going to Symbology and making them smaller.

Project Create Print Layout

Layout/Layout Properties

Add a new map to the layout.

Under Item Properties, it’s possible to set the scale.

I need a larger sheet of paper, if I want those street names to be readable.

Not sure where to set the paper size. All in all not very complicated, but I guess reading the manual wouldn’ t hurt.

Location: Pentagon, Brussels, Brussels-Capital, Belgium
Posted by mvexel on 6 March 2019 in English.

tl;dr the release notes 🙂

✨This is a big one✨ We redesigned MapRoulette to make some things easier to find, improve the workflow, and hopefully make it look prettier 💎 as well. We hope you like it!

First of all you will be greeted by a new homepage. This landing page introduces new users to MapRoulette and suggests some challenges to start working on.

New Homepage

Dashboard

An entirely new section of MapRoulette is the Dashboard. This is your personal window into MapRoulette activity. You can see things like your own recent activity, popular challenges and your tracked tasks here. As with almost everyting in MapRoulette, the Dashboard consists of widgets that you can move around, resize, add and delete to create the layout and information display you desire. You can even switch between multiple layouts.

See full entry

Posted by SimonPoole on 5 March 2019 in English.

Yes, 10 years ago was the first documented public commit to Vespucci

This seems to have marked public availability including the wiki a couple of days later.

10 years is methusalem age for Android apps given that the first commercial Android device became available at the end of 2008, Naturally both functionality and code base has developed a lot since the beginnings.

In any case thank you to all the developers that have contributed, lots of them long before I became involved and special thanks to Marcus for his contributions and for continuing to provide the access to the google play store.

Version 13

Back to current times, version 13 is nearly ready for a beta release that I expect in a couple of days.

Some of the highlights:

Support for multi-polygon, improved area and turn restriction rendering and improved styling configuration

See full entry

I am gradually scanning imagery for the Albuquerque area to map photovoltaic solar panels–mostly rooftop, but I tag ground installations when I find them. At present the Mapbox Satellite imagery for the area bounded by I-40, I-25, the southern city limits, and San Mateo (and a line extending south to the city limits) has been scanned, and PVs within it have been tagged. I will update this as I systematically extend this area eastward and then begin areas north and west of the I-25/I-40 interchange.

Most PV installations in the area are on flat roofs, and can be detected only from aerial/satellite imagery. It is not uncommon for one rooftop to hold several sections of panels, separated by open roof areas. I am tagging each rooftop bearing PVs using a single point, even if the roof holds several areas of panels. There are also a few large installations holding large numbers of panels on the top surfaces of parking shelters. Where these are clearly part of one installation, as at the parking area for the Albuquerque Sunport, or at the VA hospital, I am again tagging each as a single point, with a note that it is a more extensive area. If guidance from the OSM community clarifies how to tag these, I will revisit these and remap them.

Business took me to Dashoguz for three days, including surveys of the surrounding area and observation of conditions in rural villages. In the course of travel I collected over 30,000 Mapillary images (now being uploaded, be patient!) plus eight previously unmapped gas stations. I also collected station numbers for two already on the map, and deleted station 40, since it has been demolished to make way for new residential apartment buildings.

My team and I also collected several dozen village names, as well as major streets and POIs in some of the towns and cities in Dashoguz province.

You might ask why gas station numbers are a focus. In Turkmenistan each station number is unique. If a traveler’s car breaks down, he will tend to look for the nearest gas station for help. If we have the database of gas station numbers in OSM, it will be easier for friends to find broken down motorists stranded at a gas station. We also collect hospitals and clinics, and map them, as well as police and government offices.

Location: Daşoguz, Dashoguz Region, 746300, Turkmenistan
Posted by c1c2t3 on 2 March 2019 in English. Last updated on 3 March 2019.

Recently I am mapping the fire hydrants and just learned that the color indicates a different water source. For example, red=freshwater; yellow=sea water. Not knowing how useful it is, keep adding those missing info seems interesting.

Tag:emergency=fire_hydrant - OpenStreetMap Wiki

References

Location: Tai Po Kau Tsung Yuen Village, Wong Yi Au, Tai Po District, New Territories, Hong Kong, China

Hi I’m a new user from Linz, Austria. My main interest would be in documenting and mapping art in architecture (as soon as I get a hold of the functionality of adding stuff to OSM). Old housing complexes get demolished frequently and with them the murals that sometimes decorate the outside are lost forever. It is worth documenting these sites before they are gone.

A major problem at the moment is that OSM seems to load bigger cities quite qickly (Cardiff, Berlin), but with smaller cities like Linz and even when loading Vienna, zooming in on a street can cause the map to get stuck with blank, grey fields and/or highly pixelated areas that just do not finish loading properly at all.

Is there some way to get around this issue?

Second question: How can I add murals and art in architecture along with photos?

Posted by kastellano on 28 February 2019 in English.

Hello.

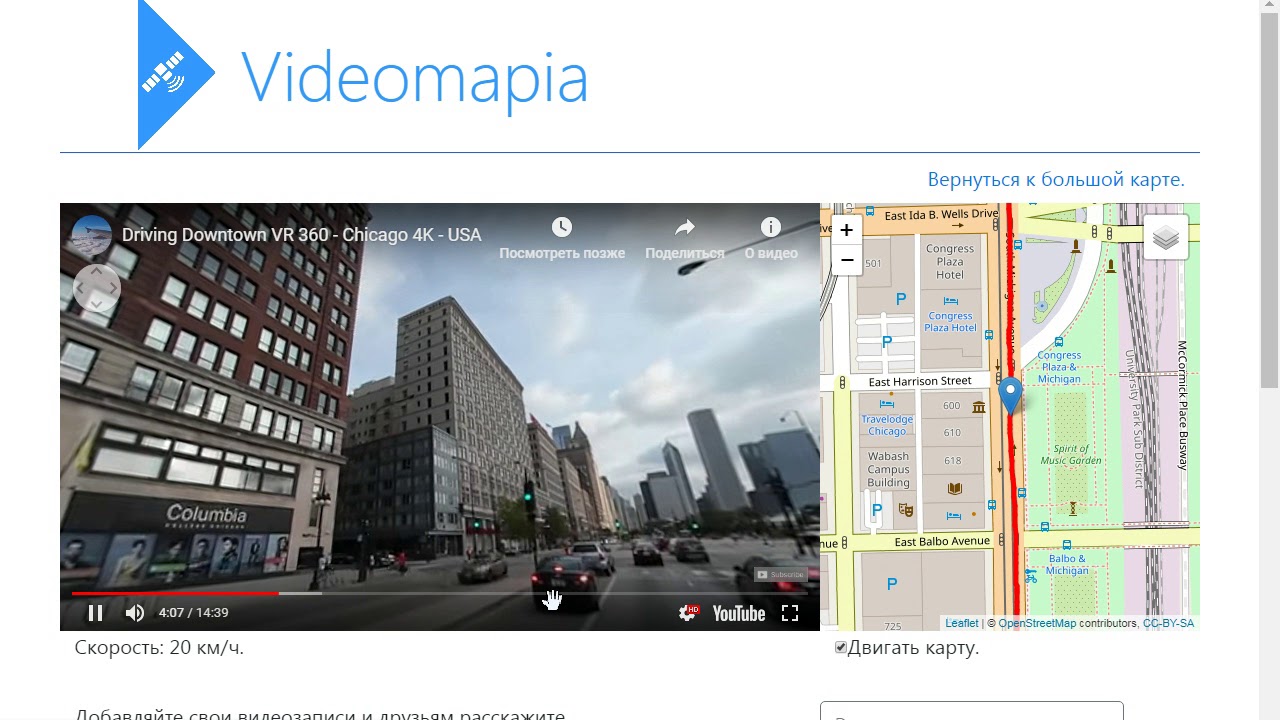
I create a Videomapia. This is a geo-search of videos. For the searching it is used GPS. Therefore, the accuracy of the search is very high.

The site is a bit like Google Street View or Mapillary. But watch the video more interesting. It moves and there is a natural sound. Videos are added by users in various places. Often in these places there are no photos of other services. Just this уasy to add new data, no need to install applications, etc. Just need a video camera and gps logger.

videomapia overview Watch a overview of Videomapia - Sometimes there are 360 videos, but usually they are dashcams.

On the first page of the site there is a map on which the red lines show the places where the video was filmed. To search for videos, left-click on the map where the red lines are. Previews of found videos appear on the left. There are also links to watching videos.

See full entry

Posted by combloop on 28 February 2019 in English.

I just finished Oradell! This took quite some time (over a month), with a few breaks in between. I finished the western portion pretty quickly, but the portion east of the Hackensack River was not completed at as fast of a pace for some reason.

One noticeable change I made around Oradell was adding on to the Hackensack River, which for whatever reason was incomplete on the map. Now, one could actually tell that Van Buskirk Island County Park is actually an island, and see 4 other islands that are just appear to be woods on the map.

I may come back to Oradell to add businesses; I would first do them in Hackensack though.

Next comes Emerson.

Click below to see Oradell!

Location: Oradell, Bergen County, New Jersey, 07649, United States

I’ve been reflecting some more on how to do research about and for OpenStreetMap recently. Here’s my latest brain dump:

One of the reasons I’m afraid to do my PhD research is because ethnography and mapping are not a usual combination in both the academic and professional spheres in GIS. Mapping is used in doing the usual ethnographic studies. But the ethnography of mapping itself seems to be rare. It flips the gaze around - instead of the mapping professional observing the place and people, it is the mapping professional who is being observed.

This method lays bare many of the values, assumptions, and interests that we the mapmakers have when performing the social, technological, and scientific work.

Please let me explain further. My favourite metaphor is about restaurants and food. Some people are only interested in the food itself - how it tastes, etc. Others are interested in what happens in the kitchen - the recipe, who the chef is, etc. Others are interested in what happens to you after you eat it and go home. Only a few are really interested in how the ingredients were farmed; the ethics of the farming labour; how much water was consumed and carbon dioxide released in farming; lost food mass in transport; energy used in trucking; what happened to the budget of the customer; the news and gossip that went around because of the eating experience; the number of likes that the food blogger got, etc. In contrast, we are only usually interested in what is served in front of us. In other words, I just want a nice meal. I just want to have a good map in my hand.

See full entry

Monday Feb 25, 2019 My concern is that large areas of predominately forest land in rural B.C. have not been adequately dealt with in terms of Land Use. In B.C.and in the particular area that is my concern, all of the land base has been allocated. Some has been acquired as private land, some as institutional land, and large portion licenced for Managed Forest use, under Tree Farm Licences. In addition, large portions of private land have been categorized as Tree Farms with significant tax advantages, in return for which the land is to be managed using sound forestry principles, similar to those required for Tree Farm Licences..

These previously untouched forest lands have been managed as industrial forest lands, and many of these lands are only accessible through roads that are classified as Industrial Roads.

The extent of industrial activity on these lands is visible from the roads, and very easy to see on the aerial photos, e.g Bing aerial imagery or Mapbox Satellite photos.

The net result of my mapping activities is to have large watershed base units categorized as natural=wood, with specific areas that have subject to industrial activity, i.e. harvesting, also categorized as landuse=industrial and industrial=forest.

In this way, both the vegetation and the land use reflect most closely the actual situation for both specific areas, and large areas. Land use and Natural classifications can coexist without conflict.

To look at a sample of how these two classifications can coexist without conflict, see the following area (or follow the location below): osm.org/?mlat=49.4090&mlon=-125.0980#map=14/49.4090/-125.0980

My overriding concern is that large areas are being depicted as natural areas, without adequate notice being taken of the effects of industrial activities - road building, harvesting, regeneration and second growth stand management, that are changing the face of the landscape.

I would appreciate any comments on this particular issue.

Location: Area D (Sproat Lake), Alberni-Clayoquot Regional District, British Columbia, Canada
Posted by iandees on 25 February 2019 in English.

I’m running for OpenStreetMap United States board in the upcoming board elections.

This was a tough year for OpenStreetMap US. We ran a great State of the Map US in Detroit with an amazing local team. We hired an executive director and found that our expectations for the job differed drastically. The hiring process, working with the new executive director to get started, and going our separate ways were extremely draining and took a lot of wind out of our sails.

This coming year, I’m looking forward to reengaging the community so we can bring back the feeling of camaraderie that makes OSM US so powerful. I want to bring back things like the Mappy Hours, work harder to get members of our community out advocating for OpenStreetMap with travel grants, and move State of the Map US back towards a grassroots feeling that empowers and excites our community.

I continue to believe that OpenStreetMap US can’t get much done without people interested in helping move it forward, and I want to see us bring more people into that fold. Please join us, vote, and participate!

Location: Hamline - Midway, Saint Paul, Ramsey County, Minnesota, United States
Posted by apm-wa on 23 February 2019 in English.

Bouygues, the French construction firm, has won tenders for five new buildings, and they are well underway: two bank headquarters, a new state tribune, a convention center, and a luxury hotel. Rönesans of Turkey has two more contracts, an expansion of the Nusay Hotel and construction of the Garagum Hotel near the airport. GAP Inşaat of Turkey is building a new burn center (hospital) on Bekewe köçesi. I’ve added those construction sites to the map and where possible have added photos of the billboards about the projects to Mapillary, such as this one for the convention center.

My current effort is to finish collecting gas stations so that travelers in Turkmenistan can easily find them, and to geolocate and label properly the major performing arts centers in provincial capitals. We stage our summer and winter film showings in these theaters, and I was surprised to discover that while on the map they were not tagged properly.

Posted by pangoSE on 22 February 2019 in English.

Hi I recently began to investigate the forced labor camps in China and found this list:

Would somebody here be interested to help map these?

Verification on ground would be nice so lets add a fixme=”verify on ground” to all of them.

No.	Location 	Floor area(m2) 	Building capacity (m2) 	Area expanded after 2017 (m2)
1A 	N:38°58’07″ E:77°26’05″ 	294845 	132000 	102000
1B 	Next to A 	                        30000 	11000 	
1C 	N:38°59’40″ E:77°26’44″ 	70143 	55810 	
1D 	N:39°01’07″ E:77°27’40″ 	9213 	5760 	
1F 	N:39°03’21″ E:77°26’09″ 	15429 	4200 	
2 	N:37°54’45″ E:77°20’55″ 	230748 	230560 	199556
3 	N:38°19’02″ E:77°12’37″ 	36889 	80904 	80904
4 	N:38°21’45″ E:77°13’29″ 	49038 	86712 	86712
5 	N:38°24’47″ E:77°08’54″ 	85280 	57964 	33348
6 	N:38°21’23″ E:77°15’51″ 	380240 	67242 	67242
7 	N:38°56’14″ E:76°03’20″ 	30000 	10238 	
8 	N:38°56’14″ E:76°10’14″	5600 	3882 	
9 	N:39°28’18″ E:75°41’55″ 	139918 	91920 	
10 	N:39°23’26″ E:76°01’23″ 	64449 	22800 	
11 	N:39°21’34″ E:75°51’51″ 	64288 	87915 	78315
12 	N:39°21’29″ E:76°03’04″ 	120700 	306000 	300000
13 	N:39°13’15″ E:76°46’06″ 	8649 	5856 	
14 	N:39°25’47″ E:76°03’19″ 	18975 	16456 	
15 	N:39°22’03″ E:76°00’37″ 	3600 	2700 	
16A 	N:38°21’45″ E:77°07’16″ 	27750 	13002 	13002
16B 	N:38°21’48″ E:77°07’08″ 	56700 	26280 	26280
16C 	N:38°21’55″ E:77°07’10″ 	47488 	17644 	
16D 	N:38°21’43″ E:77°07’20″ 	9450 	3400 	3400
17 	N:38°54’43″ E:77°38’58″ 	3400 	4368 	
18 	N:38°21’06″ E:77°18’21″ 	48617 	53984 	53984
19 	N:39°47’03″ E:78°33’41″ 	20050 	22390 	13590
Total 		                   1,871,459 	1,420,987 	1,058,333

Found in OSM:

  • 1A Todo
  • 1B (southeast of 1A) Todo
  • 1C todo

https://www.theepochtimes.com/mapping-a-human-rights-horror-calculating-the-detentions-in-xinjiang_2750362.html

I used to live in Belfast, for around 5 months in 1995. I went there to do a piece of research, some of which was ethnographic, and the rest of it was a few visits to the Northern Ireland Statistics Office. It was an amazing time for that city in terms of peace breaking out, and a City literally stretching with a sigh of relief. And it was an honour to be there at that time. Since my return to Dublin, I only went back three times. Which is very little for a place that I felt very much at home in.

Heading up with my mapping buddies Lineo and Tad we talked about how streetsigns and road markings have subtile differences across the now infamous brexit hard/soft border.

Lineo compared the border to that between Lesotho and South Africa, while Tad resolved to come back this way on his motorbike and capture as much imagery as possible while it remains open.

Arriving at Queens

See full entry