 OpenStreetMap

As it was recently discovered, Pokemon Go users have found (or, at least, they think they have) that OSM data affects Pokemon “nests” location. Some of them immediately started adding fake map features. Here are several examples:
 Washington, Indiana, United States, this user osm.org/user/forever2darkness/ , fake residential areas and footways. (Reported to DWG)
Diary Entries in English
Recent diary entries

Continuing from our previous diary post on inconsistent edits observed, here are the inconsistent edits observed in OpenStreetMap between 26 December 2016 - 27 January 2017 using OSMCHA.
We commented on the changesets:
- Deleted main stream and added an incomplete one: changeset
- Deleted existing roads and buildings: Changeset 1, 2, 3
- Added unnecessary trunk roads: Changeset
- Deleted buildings: Changeset 1, 2, 3
- Deleted roads: Changeset 1, 2
- Added unconnected footways with footway=crossing, crossing=zebra for the whole length of the road: Changeset
- Added self intersecting footway that goes over a building: Changeset
- Added address in
nametag: Changeset - Added single large buildings for many buildings instead: Changeset
Community members commented on the following changesets:
- Deleted park and bicycle way: Changeset
- Deleted footways: Changeset
- Added tertiary tags to residential roads: Changeset
- Deleted POI’s and some buildings: Changeset
- Added
barrier=wallall over the street: Changeset
Reverted:

This footway existed for a long time but nobody marked it.
Gandhi maidan.
Park
Reading this thread from the Tagging mail list, I’ve noticed several posts describing a problem of lacking governance, leading to endless (even looped) discussions and other negative consequences for the project. I agree with that because if we really want to create, maintain and improve “the best map of the world”, it is counter-effective to rely on natural evolution only. Obviously, it will take too much time.
But I don’t think that governance requires a government as a group of people, like Mark Bradley have proposed in that thread. It could be enough to have a formal guideline or a declaration of goals. For example, we can endlessly argue about semicolon-delimited values, presenting nicely polished pros and cons. But it is impossible to have a consensus if we don’t have a goal or a guideline to test a certain proposal or a statement against it.
Like, how important is it to be able to query any new tag with an Overpass API? Is Overpass API a key part of the OSM infrastructure, or not? Should we care about having a universal meaning of every tag in any country? Should we care about not having a non-verifiable, vague or relative definition of a tag? What about overlapping definitions? Is it important not to force a data consumer to conduct a detailed research on every tag before he’d be able to use it? Is it acceptable to have a scheme that requires a pre-processing with a spatial query?
Without a common goal, any discussion inevitably degrades into a contest of personal views. A special group of people can’t fix it because they also need something to test everything against it. They can, probably, try to replace it with their wisdom, but it doesn’t seem to be a good idea.
Guidelines could be developed as a GitHub-hosted document(s) to be able to actually develop it and to maintain full control over it, instead of using a bit anarchist Wiki style.

I am grateful for the HOT Voting Members nomination by Adityo Dwijananto, DMI Project Coordinator Indonesia. Please find below my personal statement.
How did you become involved in HOT?
I was first exposed to the work of the Humanitarian OpenStreetMap Team in Indonesia as a Communications Specialist back in early 2014. Coming from neither Geography nor IT related background, I was confronted with a significant challenge trying to understand even the most basic terms used in what I see as somewhat foreign and uncharted field. I was lucky enough, however, that I got to work with a bunch of patient and talented group in HOT Indonesia as it gave me space to slowly digest and connect the dots between my social and international affairs background with a more technical domain. And to come to think of it, coming from a non-technical background has helped my work which is, in a nutshell, to try to convince people that mapping is not as difficult and as technical as it seems. This has enabled me to relate more on the way muggles see crowdsourced, digital mapping from an external, non-technical persons’ view and communicate it in plain language that community members can relate to.
Could you tell us about your involvement in HOT, mapping and/or humanitarian response?

It took a few days before the penny dropped for me with this house-name from Imperial Avenue, Gedling:

For the benefit of those whose only connection with English is Received Pronunciation (“RP”):
Those speaking RP will always pronounce the ‘H’ in “his” or “her’s”. There are many regional dialects within England that would never pronounce the ‘H’ (mine own dialect was Yorkshire, although now diluted by spending 30+ years in Nottingham). It is most typical within colloquial English to hear the ‘H’ dropped in such words.
PS
What a classic street-name for the 1920/30s!
Posted by poornibadrinath on 25 January 2017 in English.


When you happen to walk on a street, what usually catches your eye? The street? The trees? Or a cute little shop in the corner having a neon sign board saying pastry? Shop with a pastry sign, mostly! Such shops, stores, restaurants, bakeries, ATMs, etc. are what we call Points of Interest (POI). POIs makes the map well, interesting (pun unintended). It is equally important as streets and buildings to any map for navigation.
Mapping POIs usually requires a mapper to collect GPS traces and take photos on the ground. With Mapillary street-level photos, anyone familiar with the city can look at any Mapillary photo taken by others and use them for mapping POIs.
Here’s how you can map them👇🏻
- Open an area you are interested in JOSM.
- Enable the Mapillary plugin to see the images of that street. If you don’t have the plugin available go to Preferences > Plugin.
Today begins my mapping journey. I have not taken on any specific tasks, but for now my only aim is to learn by slowly correcting errors and adding more details to maps of my city. Bring a programmer with a passion for maps and graphs and all things data, I’ve decided to take on OSM as a hobby and learning tool. Eventually I would love to get into scripting my own very interesting visualizations on maps!
Posted by TheDutchMan13 on 25 January 2017 in English.
Last updated on 8 April 2017.

In Order
- I 43: Completed
- I 55: Completed
- I 64: Completed
- I 69: Completed
Stay tuned for more updates. If you know of anymore interstates that need splitting let me know in the comments.
Update 1
- I 77: Completed
- I 80: Completed
- I 82: Completed
- I 84: Completed
- I 90: Completed
Project Completed 02-01-2017
You may be interested to observe the anal retention (twice over) in this view of St.Mary’s Avenue, Gedling.

- The first is in the spelling of the street, as in the signpost at left foreground. Notice the full-stop after the “ST” & the apostrophe within “Mary’s”. The street to the south runs parallel to St.Mary’s & is called “St.Michael’s” (same stop & apostrophe). Excellent. I’m with Lynne Truss on this.
- The second is the weather being anal retentive, due to the presence of an inversion layer.
Chris Fawkes, the weather forecaster on PM, BBC Radio 4 (56:16), spoke of a weather balloon launched today at Nottingham (where I live) which measured the base of the inversion at only 100m from the ground. This inversion is pretty much country-wide and is responsible for some foul air, particularly in the cities.

I first got involved with Humanitarian Openstreetmap in February 2014 when Mount Kelud erupted in Indonesia and I saw the power of concentrated crowd sourcing in action. It was impressive. I also realised that it was the ideal way to contribute to Humanitarian disasters and crisis because the time and effort put into mapping would go directly to the people who needed it the most, and it would be immediately available to them. It was here that I realised this would probably be the way that Openstreetmap would reach the idea of a basic map of the world. With concentrated efforts like this. When Missing Maps started up their Mapathons in London in late 2014 I travelled in to London to meet with like minded people who wanted to fill in the blank spaces. Because of my mapping background I was elevated to helper and then tutor quite quickly and I was achieving far more mapping by helping others to get started than I would achieve on my own. I became an active member of the HOT Training Working Group. I was also able to help the London Mapathon evolve into it’s present format of three sections …. iD, JOSM and Validators … and have been involved in 36 Mapathons to date helping the London team introduced Humanitarian mapping at many corporate and educational venues. My record of involvement ( http://tasks.hotosm.org/user/RAytoun and http://hdyc.neis-one.org/?RAytoun ) shows that in a little less than four years I have created over 11,400 changesets and worked on 180 Tasking Manager projects which include HOT activations such as Mount Kelud, West Africa Ebola Outbreak, Malawi Floods, Typhoon Ruby, Cyclone Pam, Nepal Earthquake and Hurrican Matthew to name a few.
Posted by Dewi Sulistioningrum on 24 January 2017 in English.
Last updated on 25 January 2017.

Hello HOT community,
First I would to thank you to Yantisa Akhadi for the nomination. I am really appreciate and excited to become nomination in HOT Voting Member. In this diary, I want share my statement for several question related that :
How did you become involved in HOT
My first time involved in HOT Indonesia at February 2012, HOT Indonesia, AIFDR (now DMInnovation) and BPBD DKI Jakarta open opportunity to digitize RW boundaries and infrastructures in Mapping DKI Jakarta project. The collecting data in the project for support flood disaster in DKI Jakarta. After the project, HOT Indonesia open recruitment for Trainer in SD4CP project. I applied and get the opportunity to work in the project since September 2012. I began to teach the local government and community to mapping with OpenStreetMap in their region. I also learn and teach about QGIS and InaSAFE with related with Disaster Management. As trainer, I not only teach them about OpenStreetMap, QGIS, and InaSAFE, I creating and update training material with team. Currently, I have given opportunity as Mapping Supervisor in PDC Project for mapping RW boundaries and infrastructures in Surabaya City and DKI Jakarta province. I’m very happy and grateful that I’m still become part of HOT Indonesia.
Could you tell us about your involvement in HOT, mapping and/or humanitarian response?

About
As a part of Project NOAH’s mapping initiative, a team was sent to Region 1 for another installment of the OSM and Capacity Assessment Workshop. From 6-13 November 2016, planning and preparation for the workshop proper were done. Project NOAH sent a team with six personnel, who served as lecturers/speakers and proctors for the said activity.
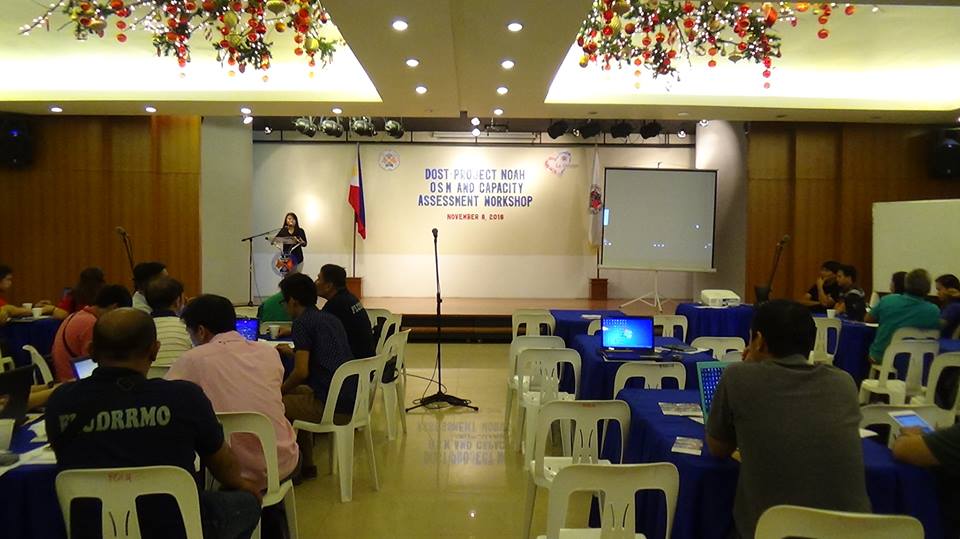
The workshops’ goal is to engage Local Government Unit officials in helping Project NOAH build a disaster resilient Philippines. Since NOAH has long embraced public participation to improve emergency response and disaster mitigation throughout the country, it is but proper to take this crowdsourced and collaborative effort to the ground, thus, to the LGUs’ jurisdiction.
The schedule of the workshop was as follows:
November 8, 2016 in La Union with 57 participants (La Union Provincial Hall, San Fernando, La Union)
November 10, 2016 in Ilocos Sur with 57 participants (Baluarte Auditorium, Vigan, Ilocos Sur)
Update on challenge status:
Crossing Ways Rail-Highway 35.6% complete
Crossing Type Rail-Highway 53.3% complete    Both types of pedestrian crossings are 100% complete.
I’m taking time to do geometric repairs as well. The result will be a reasonably correct road network near rail crossings.
The links to the remaining challenges are:
[Crossing Ways: Highway-Railway, US] http://maproulette.org/map/980
[Crossing Type: Highway-Railway, US] http://maproulette.org/map/990

The OSMF Board elections happened a month ago, but only now I’ve got my hands on the anonymized ballots. Which means we are getting some statistics.
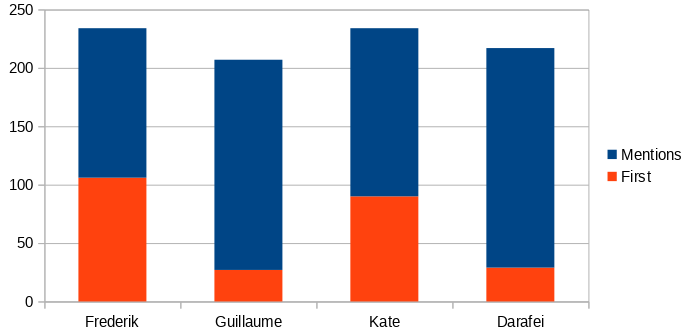
First, let’s look at numbers. By the 10th of November we had 457 members eligible to vote. That is much lower than the previous year, when we had around 500 eligible members. Still, that’s just a tiny fraction of active OpenStreetMap editors, so the room for improvement is huge. Other numbers have also dropped: 4 candidates instead of 11 in 2015, and 253 voters (55%) instead of 272 (~53%).
It was definitely the fastest and simplest of OSMF elections: with only four candidates, two of whom were running for re-election and other two much less known in the community, 77% of first choices were either Frederik or Kate. That is, Kate got three times as many first votes than the runner-up. I doubt there is a system in which the outcome of the voting would be different.
Posted by PanierAvide on 23 January 2017 in English.
Last updated on 20 June 2019.

As a developer or a map hacker, when you create maps for real world users, it is important to let them know about the context. To represent some object, a pin on a map is a start. However, it is better to visualize the object in its context, and this is best done using street-level pictures.
OK, but using pictures in web maps is hard…
Well, it was hard. There are many pictures providers (Mapillary, Wikimedia Commons, Flickr…), each of them having its own API, returning different results. It is simple to use only one of them, but what if Flickr has pictures Mapillary hasn’t ? Or the contrary ? It depends of the cities. It takes lot of time to support every provider, and it may not be worthing it for a simple map.
I agree, but why were you saying that it was hard, it is still the case, isn’t it ??
No, now it is easy to use pictures for your map. How ? Using Pic4Carto.js ! Pic4Carto.js is a JavaScript library aiming to provide pictures for your online map or application easily. It retrieves data from several providers in a single function call.
Probably, but I need a real world example.
Here it is.
A simple use case
Let’s do a simple map, showing some bicycle parkings. We will display some markers over a Leaflet map, and by clicking one of them, show the nearest picture available. The code of this tutorial is available here, and don’t forget to download Pic4Carto.js here, choose the latest dist.zip package (or if you are a hardcore dev, you can also use npm install pic4carto).
First step, create your base Leaflet map. Also, add some GeoJSON data to display (here, some bicycle parkings extracted using Overpass API).

We just updated Mapbox basemap imagery in Washington, DC with 2015 aerial imagery at 3 inch (7.5 cm) resolution.
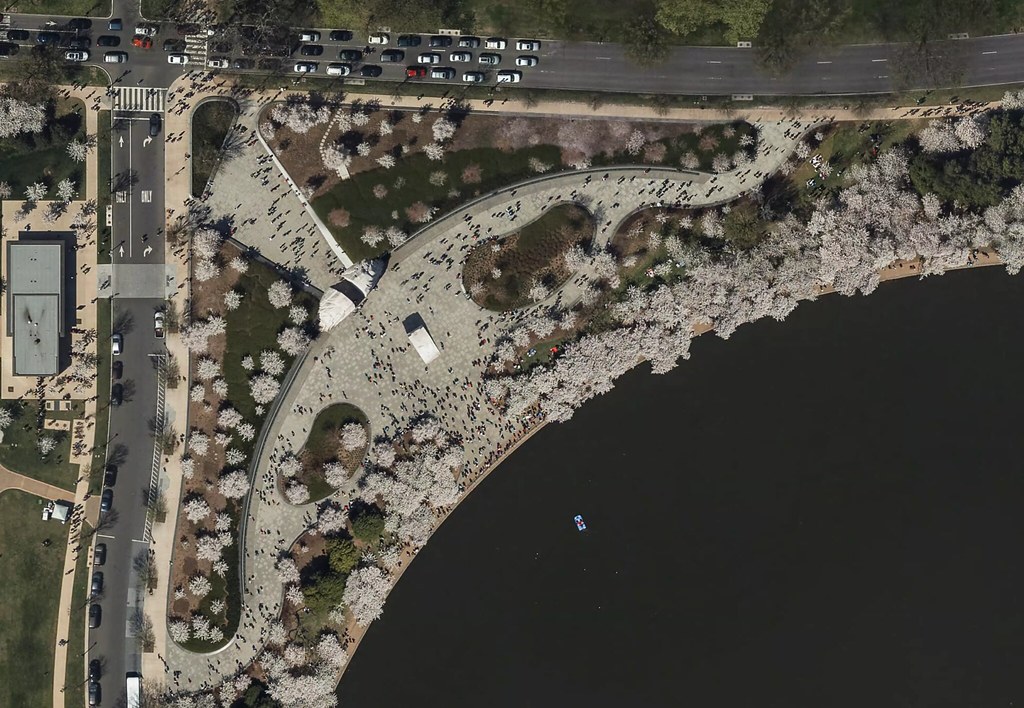 Cherry blossoms at the Martin Luther King, Jr. Memorial
The source data is openly licensed by DC.gov, thanks to the District’s open data initiative.
The imagery is ready for tracing in OpenStreetMap, where its high resolution will help with detail mapping for buildings, parks, and navigation features like turn lanes.
Posted by tasauf1980 on 23 January 2017 in English.
Last updated on 31 January 2017.

It’s been a super-fast 02 years with HOT!!!
Throughout my career in the Humanitarian field for last 05 years, I learned a lot about humanitarian works from various organizations operating in my country and found myself deep in love with the movements. Besides working with both in MSF - Belgium and MSF - Holland in the past, I have always been trying to be a part of the Humanitarian movement. However, among all the teams in this field, one team stands aside: HOT. I always feel proud to introduce myself as a part of this global team.
My history with HOT is now getting long, and my dedication to HOT stronger than ever (not difficult, with HOT more amazing than ever). I appreciate Pete Masters & Ahasanul Hoque for introducing me with HOT and continuously backing up with all my works that increased the level of commitment to it. However, it varied recently with time off for some of my personal reasons, fair to say that I voluntarily dedicate more than 30% of working time to HOT.