Diary Entries in English

Recent diary entries

Posted by Bimanywaruhanga Jonas on 8 August 2021 in English. Last updated on 14 August 2021.

This is to extend my sincere gratitude an endless favorite thanks to project which was designed to fight against Gender based violence in Bushenyi district that is run by Nuwashaba Dativer and the team,it is our pleasure as the volunteers under center for life change and development to see community members living in a harmonious way.

Location: Tshuapa, Democratic Republic of the Congo
Posted by RobJN on 7 August 2021 in English.

As of a few weeks ago, it is now possible to add Mapbox Vector Tile (MVT) layers to JOSM. I have been playing around with these to learn how to apply basic styling to the layer. For this tutorial we will use a postcodes layer in Great Britain.

Styling requires us to first create a style.json file. Copy the contents below in to a plain text file (notepad) and save as style.json. If doing this on Windows you will want to make sure it doesn’t also have a .txt extension.

{
  "version": 8,
  "name": "Postcodes",
  "owner": "Postcodes",
  "id": "postcodes",
  "sources": {
    "postcodes-source": {
      "maxzoom": 13,
      "tiles": [
        "https://api.mapbox.com/v4/robjn.3uur23nz/{zoom}/{x}/{y}.mvt?access_token=pk.eyJ1Ijoicm9iam4iLCJhIjoid0dYNkY1QSJ9.A-0lzQOawGYICYPfURsjDA"
      ],
      "type": "vector"
    }
  },
  "layers": [
    {
      "id": "something",
      "type": "circle",
      "source": "postcodes-source",
      "source-layer": "results-4326-deduped",
      "minzoom": 13,
      "paint": {
        "circle-color": "#C70039",
        "circle-radius": 6
      }
    },
    {
      "id": "secondthing",
      "type": "symbol",
      "source": "postcodes-source",
      "source-layer": "results-4326-deduped",
      "minzoom": 13,
      "layout": {
        "text-field": "{postcode}",
        "text-size": 18,
        "text-allow-overlap": true,
        "text-ignore-placement": true
      },
      "paint": {
        "text-color": "#C70039",
        "text-halo-color": "#000000"
      }
    }
  ]
}

See full entry

To all developers involved in an application which uses OSM data, either for smartphones (OsmAnd, MagicEarth, Maps.Me…) or online (Qwant maps…).

OpenStreetMap is a great database containing many type of information. All of the software I’m aware of seems to focus on explicit data (e.g. “There is a picnic table at this exact position” or “There is a rest area here”) to search for a POI, display a map or for navigation. Those explicit data come from tags directly on the POI or on a relation. But there is more to do whenever we think of what can be deduced from those explicit data to infer implicit data (e.g. “There are picnic tables in this rest area”). This would require to take into account tags on other POIs based on geometry.

What is the interest to deduce implicit data?

Imagine a family on the road looking for a place to stop: Kids will want to go to the restrooms, the driver will need some coffee and it’s time to have lunch and wait a moment we also need to refill the car. Not all rest areas/service areas propose all those services. Looking for each of those POI on a map can be quickly cumbersome (cluttering, filtering…). Now imagine if one can, when selecting a service area or rest area, have in addition to the name and opening hours of the area, a list of services available there then the decision will probably be more efficient.

Another use case is if I’m looking for a park to bring my kids. I would love to know at a single glance if a given park has some sport fields, playgrounds, toilets, ice creams… depending of what I’m looking for without zooming and panning everywhere on my map.

So how would it works?

See full entry

Posted by arnalielsewhere on 6 August 2021 in English. Last updated on 16 August 2021.

Note: This post has been translated and available in Spanish! Thanks to Cyberjuan! (Nota: Este post ha sido traducido y disponible en español! ¡Gracias a Cyberjuan!)

At State of the Map 2018, I was lucky to be selected as one of the conference scholars (my reflections here). This year, I took the chance to be part of the SotM 2021 WG to organize SotM 2021 online conference.

I mainly worked in the Communications team. I am sharing in this diary my experience and learnings as an organizer as this might help organizers in planning their online events, among others.

Long post ahead!

1. Recruiting volunteers for SotM WG (view Call for Volunteers invitation via mailing list)

Because of the pandemic, SotM became online. Since there is no community bidding involved, SotM Chairperson invited OSM community members to join the SotM WG. She promoted this via the mailing list, and was shared by community members via social media and other community channels.

Takeaway: Clearly lay out structure of the WG (sub-wg/sub-teams), its functions and who’s leading the teams, and how to join (as simple as sending an email).

2. Organizing team structure / workflow (sync and async communication)

As seen in the invitation, there were small groups/sub-wg’s within the SotM WG for a more organized coordination.

Takeaways:

  1. Coordination: Creation of sub-teams and sub-wgs, with a way to have asynchronous communication (no-meeting required coordination) for those who could not make it to the live meetings

  2. Decision-making: We arrived at decisions by building a group consensus - this have encourage more active participation from the volunteers

3. Conference Format (3 days, online)

SotM 2021 followed a 3day-format just like a physical event.

Cons: I don’t recommend the 3 consecutive days format as this is too exhaustive in the part of the organizing team (for an online event).

See full entry

Location: Denver, Colorado, United States

Every week we get an alert from the very dedicated OSMBC group, that a new issue is ready on the site. I’m in a country where internet connectivity is expensive, and slow, and unreliable, all at the same time, so I wish to avoid opening the web site with all of its javascript and css files, and only get the information without the site software.

I’ve not been able to make the above situation considered, or understood, but I could use one of the hints I received, namely to check the RSS feed for the newsletter. This feed contains one item per week, and the latest item is the one I want to receive in my mailbox. I first simply added the feed to my Android RSS client, but since every item contains links to pictures, refreshing the feed would again clog my slow limited connection.

What I did was to write a bash one-liner which will run every Sunday on a server hosted in Europe, to which I have access. The script grabs the RSS feed, extracts the first item, and sends it to me by email. Which is what I wanted, so I’m fine now.

Should anybody want to be included in the mail, I have no problem sending them any of the OSMWeekly translations. the only limitation is I can’t send email to google.com.

the script is more or less this:

wget -qO- "https://weeklyosm.eu/feed" | sed -n -e '1,/^\]\]><\/content:encoded>/p' | sed -n -e '/<content:encoded>/,/^\]\]/p' | sed -e 's/.*CDATA.//' -e 's/^\]\]><\/content:encoded>//' | grep -v '^<p class="wp-caption-text"><img loading="lazy" src=".*alt="lead picture"' | grep -v '<p><!-- place picture here --></p>' | mail -a "Content-Type: text/html" -s "OSM Weekly" email@example.com

Digitizing individual building footprints down to smaller mapping units is a tiring task but it can be achieved if you have good cartographic/CAD skills. I am viewing all my 3D building models using F4map.com, which normally takes 48hours or so before the 3D visuals can be seen in the application. F4map performs well with OpenStreetMap(OSM) if you input the correct TAGS into appropriate fields. Colors to buildings can also bee seen if you use their correct tags as well. Thanks to all those Mappers who have been assisting in populating/digitizing maps around Papua New Guinea.

Thankyou all and lets keep improving our Maps for betterment.

Posted by Maxwell-M-Blackman on 3 August 2021 in English.

After recently moving to the area I’ve found myself with the need to go out and do some GPS traces. A small sushi bar is what pushed me to go find out more about my local area and I found several shops that haven’t been mapped yet that I plan on adding, perhaps when it isn’t raining so hard.

Location: Wade, Westover, Raleigh, Wake County, North Carolina, 27512, United States

I’ve learned quite a bit over the last few weeks, so I’m re-doing some of my earlier entries.

Notes for self and others: Based on local knowledge I’ve been able to determine that the PEMA ortho images are newer than the NYS Orthos, but not by much; these are both newer than Mapbox, but Mapbox is higher resolution/clearer.

both PEMA ortho and NY Ortho appear to be positioned pretty well in the Great Bend area, but Mapbox needs to be adjusted.

ESRI world seems to use the NY Ortho in this area and their positioning is shifted slightly to the north relative to the PEMA and NYS Orthos, but it seems to be registered fairly well overall. I would tend to believe ESRI in general, but the state Orthos may be better aligned for this area. Either way, it’s a negligable shift.

Bing: don’t bother; horrible for this rural area.

Can’t tell the vintage/date for the USGS 3DEP DEM model in this area. There is a much higher resolution Lidar dataset on the USGS website.

Location: Great Bend, Susquehanna County, Pennsylvania, United States
Posted by Eiim on 2 August 2021 in English.

I’ve now been editing Oxford, Ohio for over a year, with more than 15,000 edits in the area and only a handful elsewhere. I figured it was finally time to set a proper goal for my editing: “complete” Oxford by the end of May 2022. For now, “complete” refers to mapping all the buildings, highways, POIs, and landuses, with perhaps some nuance. The details for each of these:

Buildings

By my count, there’s 7 neighborhoods/groups of houses left to map. That’s the most significant improvement from when I started a year or so ago, when we probably had around four or five neighborhoods mapped and only half of the downtown/uptown area. After those, there’s just a scattering of buildings on the outskirts of Oxford left. This phase of the project is nearing completion.

Highways

I have five goals for highways currently:

  • Consistent, accurate tagging of paths around campus

A number of paths are vehicle-accessible but aren’t labeled as such. I’m not sure what the proper tagging for those is, so figuring that out is the first step here.

  • TIGER cleanup

Easier said than done, or so I hear. tiger:reviewed=no is still on most roads in Oxford. I’ll need to do some research as to what TIGER tags should be kept or removed and such. I imagine the zip tags aren’t too useful.

  • Sidewalks

There’s lots of sidewalks around Oxford. I’ll probably map these separately, with crossings. That shouldn’t be too hard, but will take a good bit of time.

  • Intersections

I’m not sure about how much work there will be to do here, but I want to check up on things like the turn restrictions and traffic lights on all the intersections around Oxford. Some of this might be survey work.

  • Parking lots

There aren’t tons of these, but where they exist they’re very inconsistently mapped. Some work will need to be done to bring these up to standard.

POIs

See full entry

Location: Oxford, Oxford Township, Butler County, Ohio, 45056, United States
Posted by SK53 on 2 August 2021 in English. Last updated on 11 August 2022.

The other day a new user was asking questions about mapping the new development of the former Royal Engineers Barracks opposite Mill Hill East tube station. I’ll write about their problems with postcodes another time.

However, this prompted me to look at the OSM map of the area, which I knew well in the 1980s. I was a PhD student in Central London (UCL), but a close friend was doing his doctorate at (NIMR](National Institute for Medical Research), and I visited fairly frequently. Over time I got to know other scientists & staff at NIMR, not least because I became an active member of the walking group which was part of the staff club (NIMROD, which still leaves a trace on OSM), but also because of scientific collaborations.

The old NIMR main building

See full entry

Location: Mill Hill, London Borough of Barnet, Greater London, England, NW7 1QG, United Kingdom
Posted by SomeoneElse on 30 July 2021 in English. Last updated on 15 October 2021.

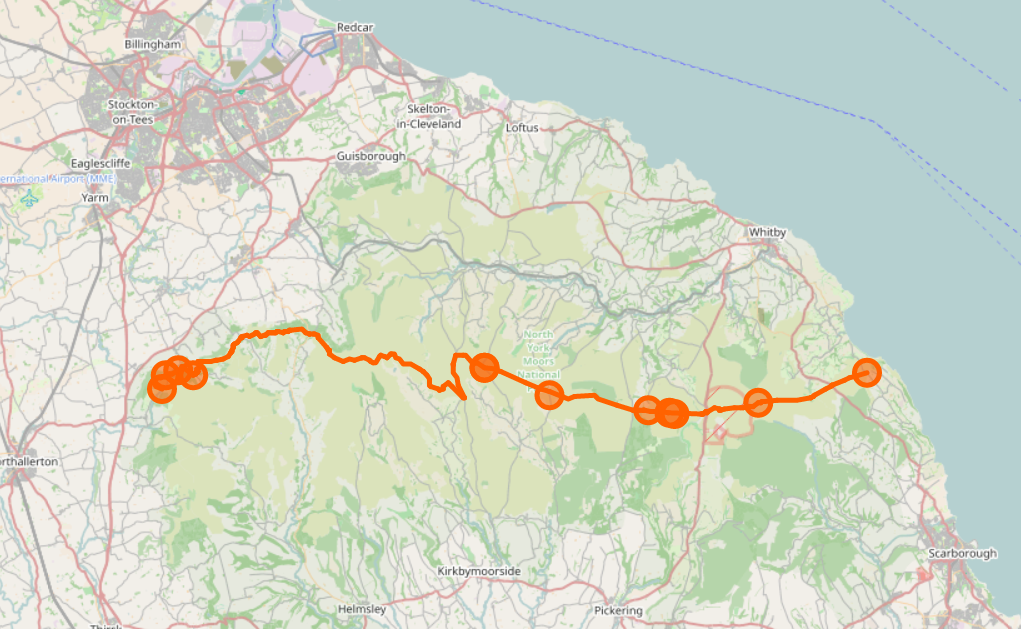
Lyke Wake Walk relation in OSM - ways and nodes

Previously I wrote about checking National Parks in Britain and Ireland for breakage, by counting the number of valid polygons in a rendering database.

A similar approach can also be used to check line features as well as polygons. It’s possible to count the number of contiguous sections of a given polygon. For example, here’s the Lyke Wake Walk, which is in one piece:

psql -d gis -c "SELECT count(*) FROM planet_osm_line WHERE (osm_id = '-1996318');"
 count 
-------
     2
(1 row)

and here is the Sabrina Way, which isn’t:

psql -d gis -c "SELECT count(*) FROM planet_osm_line WHERE (osm_id = '-537430');"
 count 
-------
    12
(1 row)

If something is changed in OSM that introduces an extra piece, or fixes a gap, that number will change. This script can be used to count the change in the number, like this:

Change in relation components for Sabrina_Way 537430
3c3
<     12
---
>     13

See full entry

Location: Stainton Hall Farm, Danby, North Yorkshire, York and North Yorkshire, England, YO21 2JH, United Kingdom
Posted by Sam Wilson on 30 July 2021 in English.

The City of Fremantle has new speed limits, mostly 40km/h. I’ve been trying to get the map up to date. They provide a bit of a map (archive), and I’m checking against the new signs as they go up. I don’t know why they don’t care about what happens west or north of the railway line.

I normally don’t really care about vehicle speed limits, because I don’t drive, but this was an interesting exercise in JOSM filters and non-geometric mapping.

Location: -32.056, 115.748

Another short post on street furniture (you can definitely tell I haven’t got out much in the pandemic as this is the sort of mundane detail I’m focused on at present). Once again these are, as much as anything, notes for myself.

The Ranty Highwayman wrote a great detailed post about the different types of tactile paving and how they should be used in the UK: https://therantyhighwayman.blogspot.com/2015/02/tricky-tactiles.html. It’s very helpful if confused about the various types, and may help to spot incorrect layouts (which can be tagged).

My only additional contribution is to note that in the UK the tactile paving slabs tend to come in a very restricted set of sizes:

  • 40 cm square. The most usual size for both blister & corduroy (hazard warning) paving. There are 6 blisters up & across. I haven’t counted the lines.
  • 45 cm square. A bit less frequent, 7 blisters across (illustrated in the blog post above).
  • larger (perhaps 60cm+). Blister interval possibly bigger than in the previous two examples, 9 blisters a side. I haven’t measure these slabs precisely, but this is an example on Mapillary.

More examples of tactile paving can be found on suppliers’ sites such as this one.

So far, so unbelievably nerdish, but there’s a nifty bit of knowledge from this info which can be applied to mapping much more widely! Knowing the paving slab sizes makes it easy to estimate the width of pedestrian crossings, crossings at dropped kerbs and any pavement/sidewalk where the corduroy hazard slabs are used. This can not only provide a simple way to survey widths without using a tape measure or laser device, but can also assist in estimating widths based on experience.

Location: Lenton, Nottingham, East Midlands, England, NG7 2LH, United Kingdom
Posted by pnorman on 29 July 2021 in English. Last updated on 30 July 2021.

This blog post is a version of my recent SOTM 2021 presentation on the OpenStreetMap Standard Layer and who’s using it.

With the switch to a commercial CDN, we’ve improved our logging significantly and now have the tools to log and analyze logs. We log information on both the incoming request and our response to it.

We log

  • user-agent, the program requesting the map tile;
  • referrer, the website containing a map;
  • some additional headers;
  • country and region;
  • network information;
  • HTTP protocol and TLS version;
  • response type;
  • duration;
  • size;
  • cache hit status;
  • datacenter;
  • and backend rendering server

We log enough information to see what sites and programs are using the map, and additional debugging information. Our logs can easily be analyzed with a hosted Presto system, which allows querying large amounts of data in logfiles.

I couldn’t do this talk without the ability to easily query this data and dive into the logs. So, let’s take a look at what the logs tell us for two weeks in May.

See full entry

Posted by SK53 on 28 July 2021 in English. Last updated on 29 July 2021.

Over time I’ve noticed features appearing on highways & paths which are unusual and which I don’t know how to describe. Often these become much more prevalent. Recently I made an effort to do some reasearch on a couple of these and learnt some useful terminology (documented here so I don’t forget):

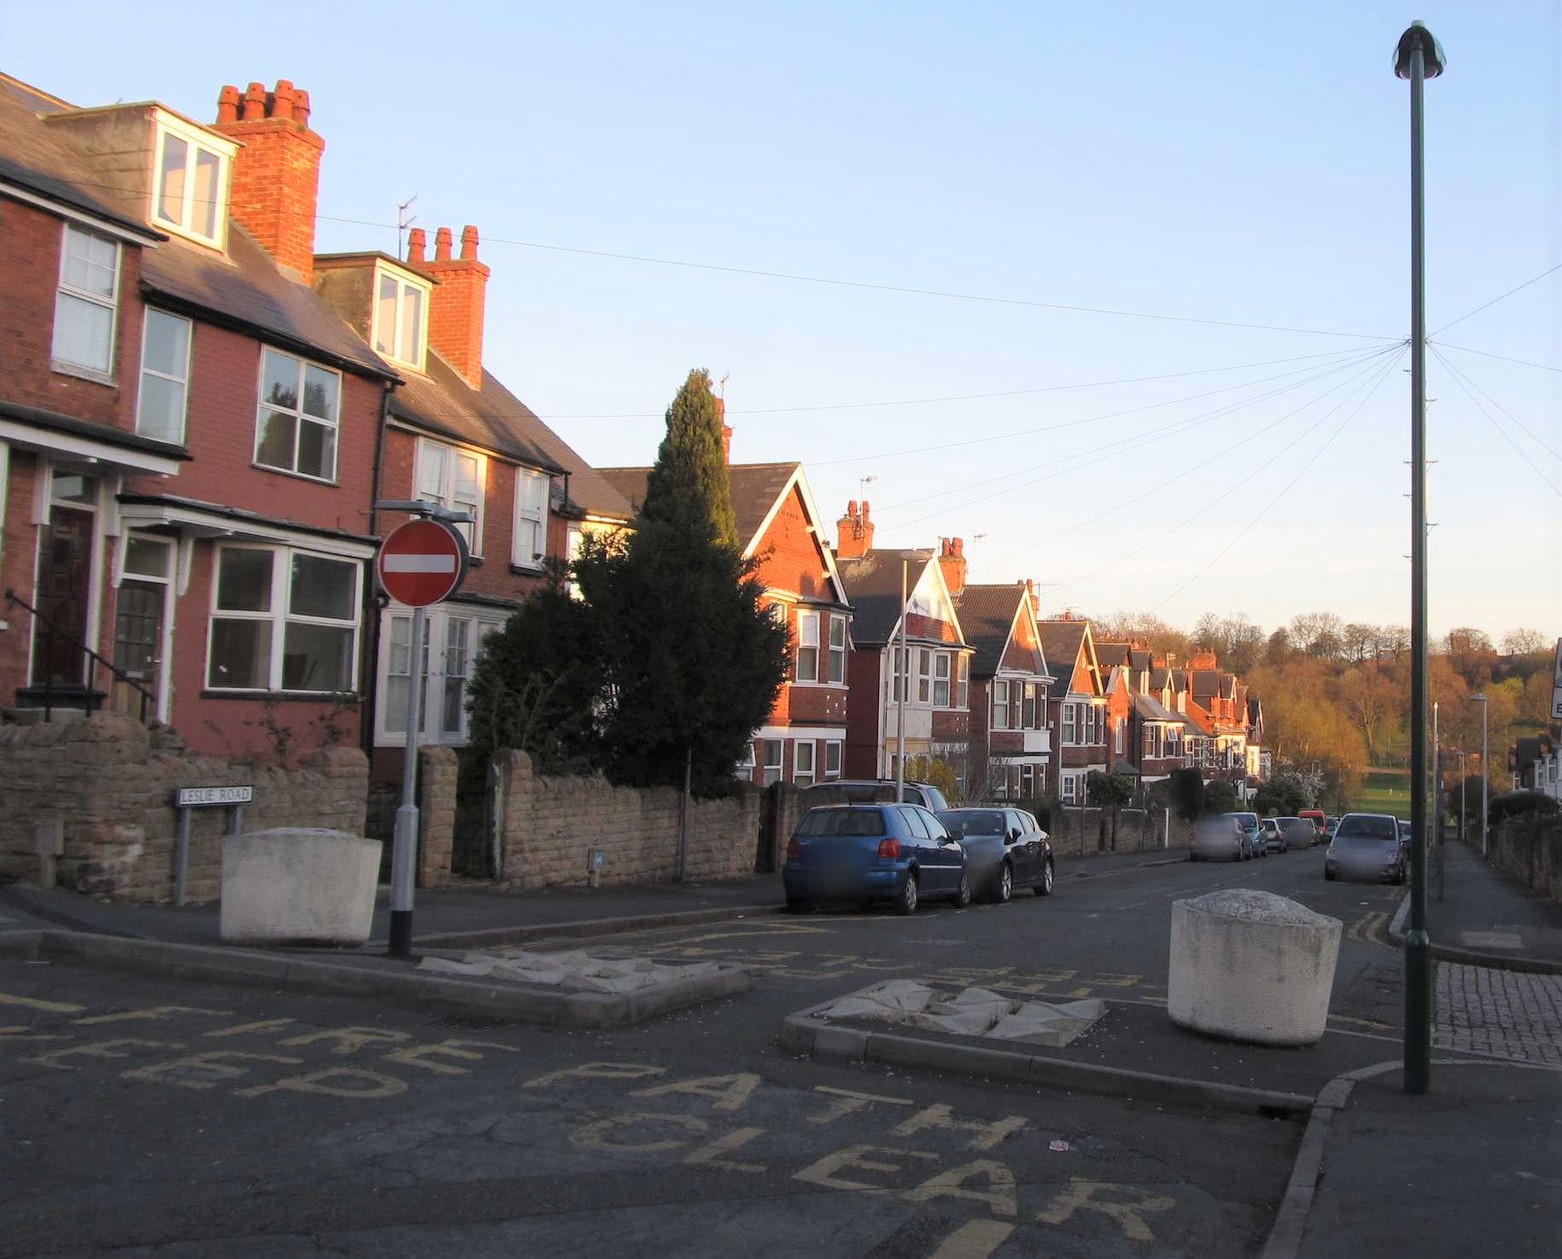
  • Deterrent Paving: These is a form of paving which it is difficult to walk or drive over. It is used in a range of situations, but a common use is where a road has been blocked for cars and cycles are allowed through but there has to be some provision for access by emergency services (often labelled “FIRE PATH” in the UK).

Fire Path featuring deterrent paving

There is quite a wide range of different types, some aimed more at stopping pedestrians. The presence of deterrent paving may represent a significant hazard for people with reduced mobility or impaired sight.

See full entry

Location: Forest Fields, Bulwell, Nottingham, East Midlands, England, NG7 6PP, United Kingdom
Posted by gpserror on 27 July 2021 in English.

Well, I just wanted to see what this feature does so I’m posting some useless stuff.

As listed on my profile page I muck with mkgmap and my Garmin Nüvi for the USA. These Nüvis can only handle 4GiB map files. So I look at the diagnostic output of mkgmap and noticed we’ve got a billion live nodes that need to be parsed for just the USA. Not exactly sure when it passed this mark, but it was fairly recent.

1 billion USA nodes, and each node has a longitude and latitude that if were represented by a floating point number (single precision float - 32 bits) would mean 4 bytes per longitude, 4 bytes for latitude. Then an identifier…

This would 8GB by itself, without ways to link the nodes. Impressive that osm.pbf can “compress” all these nodes, ways, relations, and all the tags into a (currently) 8GB file.

But anyway been trying to go through a bunch of the QA issues in the map data. I think I got through one pass of the roundabout routing issues that are shown in mkgmap. I was playing with OSRM and GraphHopper with the errors and with the fixes, I’m surprised that people haven’t found some roundabouts that OSRM/GraphHopper completely refuse to enter… they’re scared of roundabouts! Hopefully OSRM, GraphHopper, and even my Garmin Nüvi will now route through them properly.

Alright that’s enough for now here. If this text is even useful…

Posted by Zeno Kugy on 26 July 2021 in English. Last updated on 6 August 2021.

I am saving this list here as a to-do-list. Should anyone suggest a proper way to map this stuff, I will try to enter it in OSM. These are places where the owner can fine you with some hundreds euro if you drive through, if you stay more than 15 minutes at the gas station, if don’t spend enough money at the gas station, and so on.

Diese ist eine List von bekannte Besitzstörungsfälle in Wien:

  • Shell-Tankstelle, Ecke Katsushikastraße/Leopoldauer Straße 49, 1210 Wien (hinter der Brücke bei McDonalds)
  • Sackgasse Breitenleer Straße 50, 1220 Wien
  • Liegenschaft Siemensstraße 105A, ident mit Richard-Neutra-Gasse 3, 1210 Wien
  • Donaufelder Straße 135, 1210 Wien (zwischen Hofer und Einkaufszeile Schichtweg)
  • Franz-Eduard-Matras-Gasse 5-7, 1220 Wien Es handelt sich hier um eine Sackgasse an deren Ende es kein Weiterkommen für mehrspurigen Verkehr gibt. Das Wenden des Fahrzeuges ist nahezu unmöglich. Deshalb nutzen viele Lenker die Möglichkeit und wenden in einem anliegendem Grundstück. Da dieses überwacht wird, kommt es in jedem Fall zu einer Besitzstörungsanzeige.
  • Brünner Straße 64, 1210 Wien, FS Tankstelle. Sogar Kunden der bei selber Adresse befindliche Autowerkstatt werden angezeigt.
  • Donaufelder Straße 128, Tankstelle, 1210 Wien
  • Heiligenstädter Str. 60, Shell
  • BP Tankstelle, Gaudenzdorfer Gürtel 77, 1050 Wien
Location: Katastralgemeinde Leopoldau, Floridsdorf, Vienna, Austria