Diary Entries in English

Recent diary entries

Posted by jfd553 on 5 October 2020 in English. Last updated on 16 March 2024.

I have started a Covid-19 mapping project in mid-April of this year. My objective was to map the buildings in the city I live in (and updating what needs to be). So far everything is going well. After having mapped about 30K buildings, 80% of my objective has been achieved. I keep moving forward with mapping and updating buildings and any other features that interest me.

Ho! I forgot to update the information. I finished mapping around January 2021. Since then, other mappers have started adding stores within building boundaries. That’s cool!

Location: Les Nations, Sherbrooke, Estrie, Quebec, Canada

We are about to undertake an experiement funded by the NESTA Collective Intelligence Grants to explore emerging trends in map feature digitization. You can read about the project here >

There will be more to follow for those who are interested in participating in the upcoming experiements, however, I thought it may be of interest to share some of the background first.

The project was originally applied (and accepted) by Felix Delattre and I have the good fortune of supporting its implementation. We are also partnering with 510/Netherlands Red Cross who are supprting the derivation of the ‘AI-Only’ data set.

I will also highlight, none of the data collected or used in the experiement will be added to the global OSM database, we are using OSMSeed instances with customized Tasking Manager instances to sandbox the entire project for data gathering.

Comments are welcome as we refine the design. The next entry will have more info for the specific experiemental design, so that may be a better opportuity also.

Enjoy.

Experiment: Comparison of machine learning assisted and traditional digitizing of map features in OpenStreetMap

Hypothesis Machine predicted map features, from state of the art machine learning models, can effectively and efficiently (w.r.t the quality and speed of mapping results) assist and improve the current volunteer mapping in OpenStreetMap.

Context Evidence-based approach to get insights about the effectiveness and efficiency of machine learning assisted methods for mapping in OpenStreetMap. Build trust through arguments. Elaboration of a scientific publication, shall be open data, open access, open science. Publish datasets and all documentation with open licenses to allow calculations to be transparent and reproducible, and this provides a general framework for conducting measurable and comparable experiments around this topic.

Sample groups

See full entry

Location: Naz, Esserts-Salève, Monnetier-Mornex, Saint-Julien-en-Genevois, Upper Savoy, Auvergne-Rhône-Alpes, Metropolitan France, 74560, France
Posted by John Stanworth on 4 October 2020 in English.

It’s now 3 years since I started mapping the footpaths near Sheffield. In that time the project has clarified. I now have a rough circle drawn around Sheffield on an OS map. It has a radius of about 10miles. Within that area I am trying to complete the mapping of all (or as near to all as I can get) of the countryside paths. I have completed the western half of the circle. I have found that less than half of the paths were mapped to the north and west of the city but some areas to the south of the city are almost completely mapped. My method is to take a small area of countryside, usually enclosed by roads and spend a day surveying and mapping all the paths in it. I map on my phone as I go using Go Map!! When I’m happy that all the paths are mapped to a reasonable standard I colour in that sector on the OS map. At the moment I am heading east and south from Wath Upon Dearne and heading east from Dronfield. If I keep going at the current rate I estimate that I will have coloured in the whole circle by 2023. That is if I don’t get distracted by other mapping projects. So far the footpath mapping has been interrupted by periods of post box mapping around Sheffield and more recently by defibrillator mapping.

Location: Sheaf Valley Quarter, City Centre, Sheffield, South Yorkshire, England, S1 2BW, United Kingdom
Posted by Adrian 2 on 4 October 2020 in English.

Professionals have used dual-frequency positioning receivers (SatNavs) for many years. But they are expensive. Recently, much lower-cost dual-frequency receivers have become available, such as the u-blox ZED-F9P. This receiver can operate as a regular positioning receiver, with or without RTK, or as a source of RTK corrections (RTK base station). Dual-frequency operation means that the receiver has more signals to play with, so you get a better position fix. It also means that the receiver can deduce the ionospheric corrections without the need for SBAS (also known as DGPS). The ZED-F9P receives all four constellations of satellites which are currently flying, so it has a large number of signals available. This is also an advantage for RTK, because it means the algorithm can converge in one or two seconds if you are close to the RTK base station or if you are using a Virtual Reference Station (VRS).

See full entry

Posted by mariotomo on 4 October 2020 in English. Last updated on 19 December 2024.

This is a review of a IRC meeting with the local Panamanian YouthMappers chapter at the Universidad de Panamá (YM-UP), where I have been trying to represent the interests of the OSM mapping community, with a specific focus on the quality of data in Panama.

The meeting was suggested by me, since I considered necessary to reach some understanding with the YM-UP chapter, and the date called by professor María Adames de Newbill, who, together with Prof. Humberto Smith, is formally an external support of the chapter. I had suggested using IRC, while the chapter and the university both use Zoom and meet in audio and video. My limited internet allowance in combination with the high local fees do not allow for that, but I also wanted to keep a log of the meeting, and review it with more time.

The meeting was on September 17th, more than two weeks have gone by, and as it seems, the meeting hasn’t served the purpose of establishing a stable communication. My other intention was to understand the dynamics of the chapter, and here is what I observed. The reader is invited to form their own idea, and comments will be welcome.

Youthmappers International, in the person of its director Patricia Solís says

[09:39]  DrPatriciaSolis: please encourage and support them - they are the future of OSM 
[09:39]  DrPatriciaSolis: I believe in these young people so much .... 
[09:39]  DrPatriciaSolis: we need to stay positive and encouraging 
[09:39]  DrPatriciaSolis: and help them not only technically but gain experience and leadership

I’ve never even been able to get a list of chapter members. I have commented on several changesets, and never got a reply (not even a “what do you mean by that?”), nor seen the comments processed and the mapping mistakes addressed.

See full entry

Posted by Minh Nguyen on 3 October 2020 in English. Last updated on 8 March 2026.

The other day, while adding some Ohio county roads to route relations, I came across a baffling weight limit sign:

Lilly Chapel–Georgesville Road looking north from London–Lockbourne Road

As complicated as it can be, OpenStreetMap’s maxweight tagging is designed around explicit numeric values. What good is a 10% discount when you don’t know the full price?

A state bridge inspection manual pointed out that this sign was once standardized as sign R12-H7 in the Ohio Manual of Uniform Traffic Control Devices (OMUTCD), but the sign was removed from the standard in 1997 in favor of explicitly posting the specific weight restrictions by axle count. (Old signs like this often remain until they wear out and the local highway department needs to replace them.)

At the same time, I discovered that a similar percentage-based sign has remained in the standard, now renumbered as R12-H17. Counties and townships are allowed to post it on roads and bridges to protect them during thawing season. (Other northern states have similar provisions.)

See full entry

Location: Fairfield Township, Madison County, Ohio, United States

It started by @gustavo22soares’ question on Mastodon (not archived.) My answer was:

@gustavo22soares Hi. If the question is about #damn – there is no delete area function. (It was not needed to demonstrate the concept and there is no consensus about “what after delete?”)

Regarding the name – feel free to use tags for this purpose.

After 2 weeks, there is still no delete area function. Sorry. However, we did something after all.

The damn client may be translated (and it is translated from English to Czech and Portuguese.) Areas may be filtered by tags. There is button to switch between grid and list view. And finally, the damn client supports multiple OpenStreetMap web editors. (No, there is no support for JOSM. Use the damn plugin instead.)

The defaults can be changed easily when deploying – and it was the intention.

And the last thing: I updated the server. (Because I was not satisfied with the function returning the list of the areas.) After the update, I stressed the server a little bit. It was definitely NOT load testing, but I just could not resist.

Posted by Cascafico on 1 October 2020 in English. Last updated on 10 October 2020.

Intro

Italian Ministry for Education (MIUR) publishes yearly a nationwide detailed dataset about public schools (isced:level 0 to 3). Guess which OSM-essential data is missing.

No reliable geocoding is feasible if we don’t have a homogeneous address base and I think it’s unlikely large nations (say, Italy, 60 million people is one of these) feature such quality. So we need a tool to filter approximate geocodings (typically street centroid) out from good ones.

Tools

I tried csvgeocode, a light script to insert lat and lon fields in input dataset, but it lacks in grabbing important geocoder responses like accuracy.
then I ran into Openrefine (OR) which has been created to fix “messy data”, but can be happily used to compose geocoders requests, filter responses adequately and structure output in whatever format you want.

Data

  • School buildings dataset, where address is well structured (updated 2018)
  • School details dataset 2020, where all the other stuff is stored (updated 2020)

Buildings dataset (EDIANAGRAFESTA)

Here you’ll find fields for composing geocoding request: in separate columns street type (Via, Viale, Piazza, etc), street name, postalcode, municipality. And of course, the reference field (Codice Meccanografico) needed to link the school details dataset. Using buildings dataset, Openrefine will compose columns to generate Nominatim geocoder requests, fetch URLs responses and filter out those OSM elements which “type” is not punctual (typically highway=* or blank).

School details dataset (SCUANAGRAFESTAT)

Here you’ll find stuff like school name, unique reference code (Codice meccanografico), contacts, description (for ISCED), etc. Openrefine will manage several “messy data” like accents, abbreviations, typos, titlecase etc.

Install Openrefine

OR can be installed in few steps. School datasets feature 55k+ records and OR run nice and easy on my rasperry +1Gbyte RAM board.

Importing Buildings dataset in Openrefine

See full entry

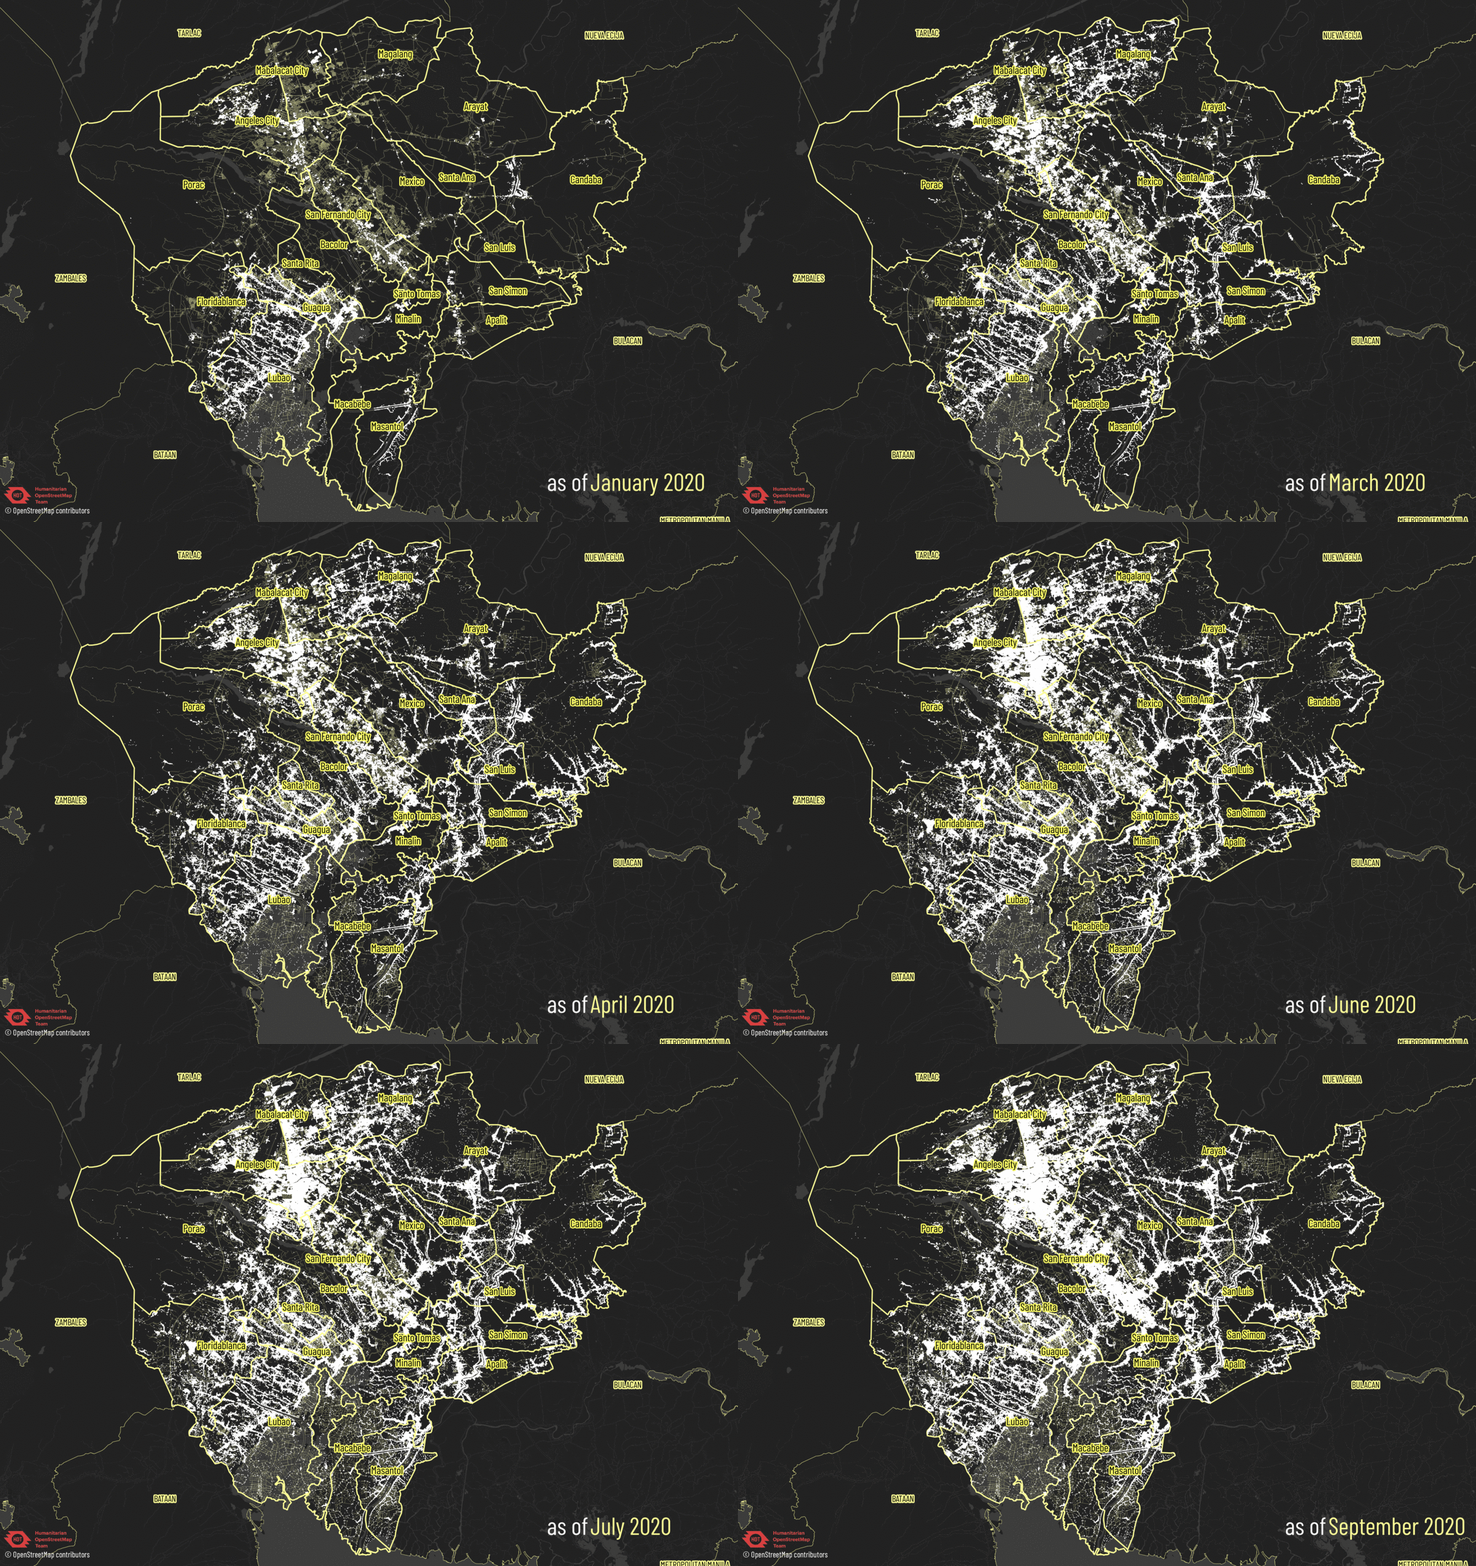
As of 21 September, the mapping and validation tasks for the campaign #PhilAWARE - #MAPampanga in the Tasking Manager have been officially completed. Quezon City and Pampanga are the two pilot areas for the #PhilAWARE project. Quezon City tasks were also completed on June 2020, as part of the #endcov initiative of HOT-PH and UP Resilience Institute.

OSM building footprints and roads in Pampanga from January to September 2020

See full entry

Posted by naveenpf on 30 September 2020 in English.

It is a long time I have written a diary. One of the most important aspects of opendata/opensource project is building a community. In order to build a community, we have to reach out to new volunteers contributing to the project.

Post State of the Map Asia 2018, the important communication channel of Openstreetmap India community has been telegram. Personally, I have installed telegram on my mobile for Openstreetmap communication.

Both India and Kerala communities have been using the telegram group for all the discussions. One of the advantages I have seen with telegram conversations are:

  1. More people are involved. (Unlike mailing list or forum.)
  2. Getting a reply is faster.
  3. Frequency of discussions has increased a lot.

On the disadvantage side, indexing or looking for a previous discussion is not easy.

After knowing about the telegram group, I used to send personal messages to OSM contributors to join OSM India or Kerala telegram communication channels. But this was a very small scale. In order to notify new users about the OSM community, another effort was to list all the OSM India/Kerala entities to the OSM community index. But, it was not much helpful. It was not catching eyeballs. I have tried RSS feeds too, but the area of selection can’t be India.

In order to build community, I have been looking for a welcoming tool for the past couple of years. Few options were to use the tools built by Belgium and the Italian OpenStreetMap community. Even OSMF local community is trying out to build something similar. What I was looking for was something similar to Twinkle in Wikimedia projects. I have used twinkle to build a good community in English Wikipedia.

1.Indian Roads
2.Indian Railways
3.Education in India

See full entry

Posted by Creator13 on 26 September 2020 in English.

A few years ago, Esri got their hands on amazing, high-res imagery of a few urban areas in the province of New Brunswick, Canada. I found this out through the Canadian tasking manager when I was a newbie looking for ways to contribute. I can only say that I stumbled upon a gold mine. Way back in 2017, I contributed to the cities of Edmundston and Moncton. When I came back this year, there was not much work left to be done in those areas and I moved on to a new project: the towns of Bathurst and Beresford. I started back in May when I was looking for some distraction during the lockdown and I picked it back up at the start of September because I was looking for some distraction from college work. I decided it would be nice to share what I’ve been up to there with the community so here it goes!

The goal

The aim of the Tasking Manager project was to just map all the buildings. Because, well, there were none at all. As I started working though, I noticed there was much more that needed to be done than just adding some buildings. Most of these areas have never been properly mapped.

CanVec

Large parts of the Canadian map have been imported from CanVec, a vector map provided by the Canadian Natural Resources organization. In the area of Beresford, the import happened back in 2012. That’s already eight years ago. And the quality of the data wasn’t particularly great. Roads are inaccurate, forests cover half the urban areas, bridges aren’t actually placed over the water, you name it.

Mapping the town

Since the imagery that Esri offers is so good, I decided I’d do more than simply add the buildings. I have been mapping as much of this town as I possibly could. That includes the buildings of course, but also the landuses, the roads, paths, forest tracks, beaches, and even power lines. I’m taking it in small steps, usually two or three changesets of about 1500 edits per day.

The work

See full entry

Location: Beresford, Beresford Parish, Town of Belle-Baie, Gloucester County, New Brunswick, Canada
Posted by migurski on 26 September 2020 in English.

Facebook is releasing an update to Daylight, our complete, downloadable preview of OpenStreetMap data.

📥 Download Daylight Map Distribution right now in OpenStreetMap PBF format: 📦 planet-v0.4.osm.pbf (59.5GB).

Version 0.4 marks the first of our expected monthly Daylight releases through the end of 2020. With this release, we are including new coastline data, updated Microsoft ML Building Footprints data, and for the first time we’re including data about specific features we’ve excluded from a Daylight release.

There’s also a new site with a machine-readable feed of future Daylight releases: DaylightMap.org.

Read the complete announcement here.

Daylight Map Distribution

See full entry

Location: Downtown, Downtown Oakland, Oakland, Alameda County, California, 94612, United States
Posted by Øukasz on 24 September 2020 in English.

I’d like to start a discussion to arrive at a consensus of standardising placenames in Kurdistan Region of Iraq.

Please comment on this entry if you would like to participate, as well as your initial thoughts and ideas.

If we have enough people who are interested in this, I will set up a more permanent place and channel for discussion (a wiki page or a mailing list).

Posted by Carnildo on 23 September 2020 in English.

I spend hours studying news reports and carefully tracing building outlines in Malden, noting which ones did or didn’t survive the Babb fire.

And then a bunch of wanna-be do-gooders come by and crap out HOT-quality mapping, complete with duplicate buildings, vehicles mapped as buildings, scribbled outlines, and nothing but self-congratulatory hashtags for edit summaries. I think I’m going to just revert the whole batch.

Location: Malden, Whitman County, Washington, 99149, United States
Posted by Glassman on 22 September 2020 in English.

The US 2020 Election is just 41 days away. Like some states my home state of Washington is all mail in ballots. But you don’t actually have to mail in your ballot for it to be counted. You can also drop your ballot off at any one of the counties ballot drop box locations.

Skagit County Ballot Drop Box in Anacortes, WA

The county has a map of all their locations but it’s not always clear exactly where the drop box is located. So what’s a OSM mapper to do? Go out and map them. The last two locations, Concrete and at the Sauk-Suiattle Tribe were added this afternoon. The Sauk-Suiattle is located in the Southeast portion of the county near Darrington, WA. While much of the county lies to the east, hardly anyone lives there.

I encourage everyone to get out and map polling stations and drop boxes where appropriate.

Tagging is simple amenity=polling_station plus polling_station=ballot_box for drop box locations. Additional tags can include operator and opening_hours.

See full entry